Overview
<<<<<<< HEAD
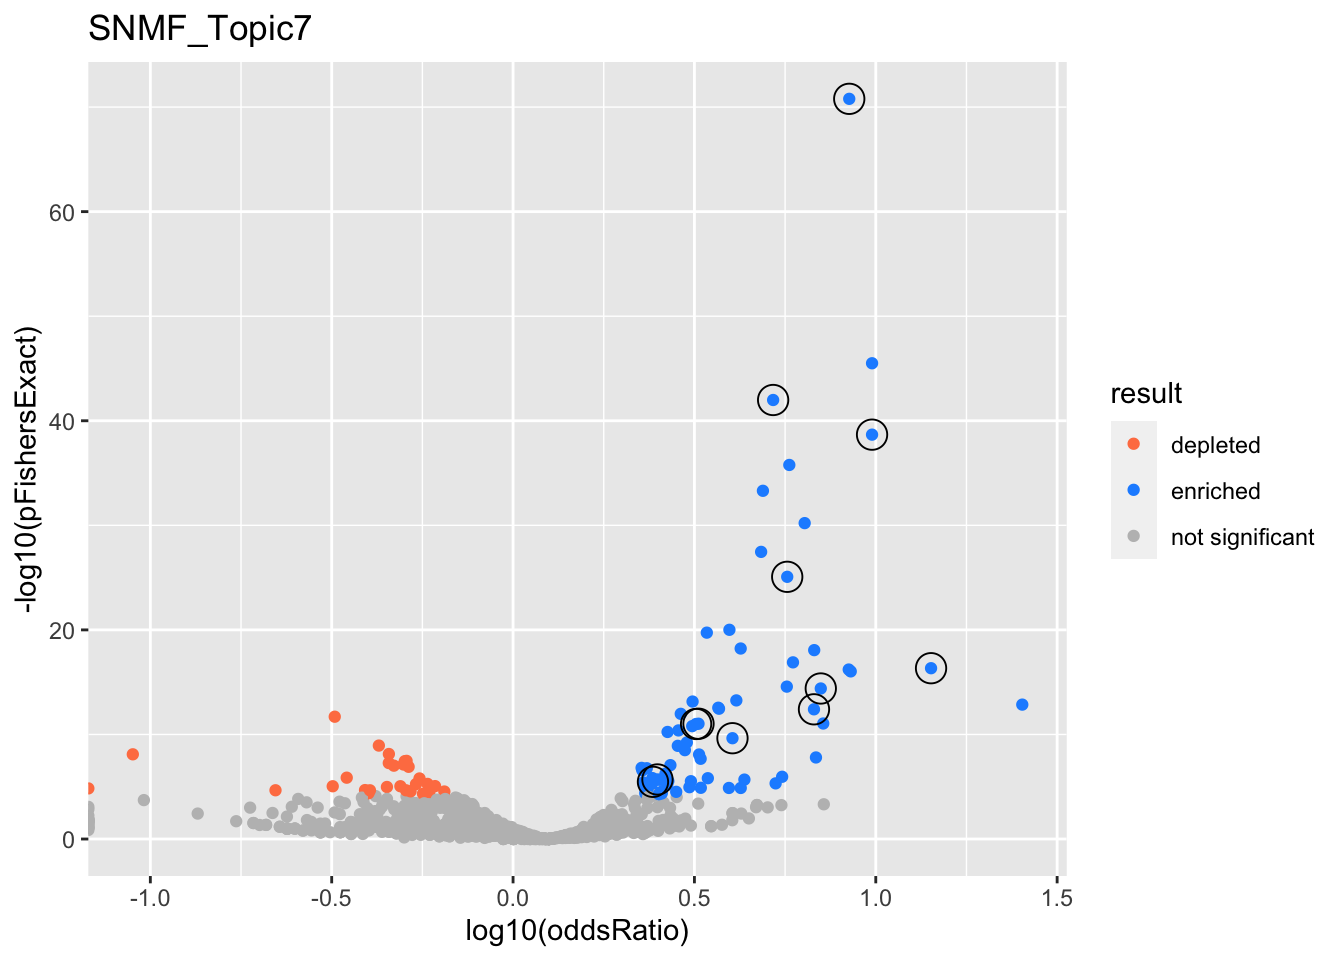
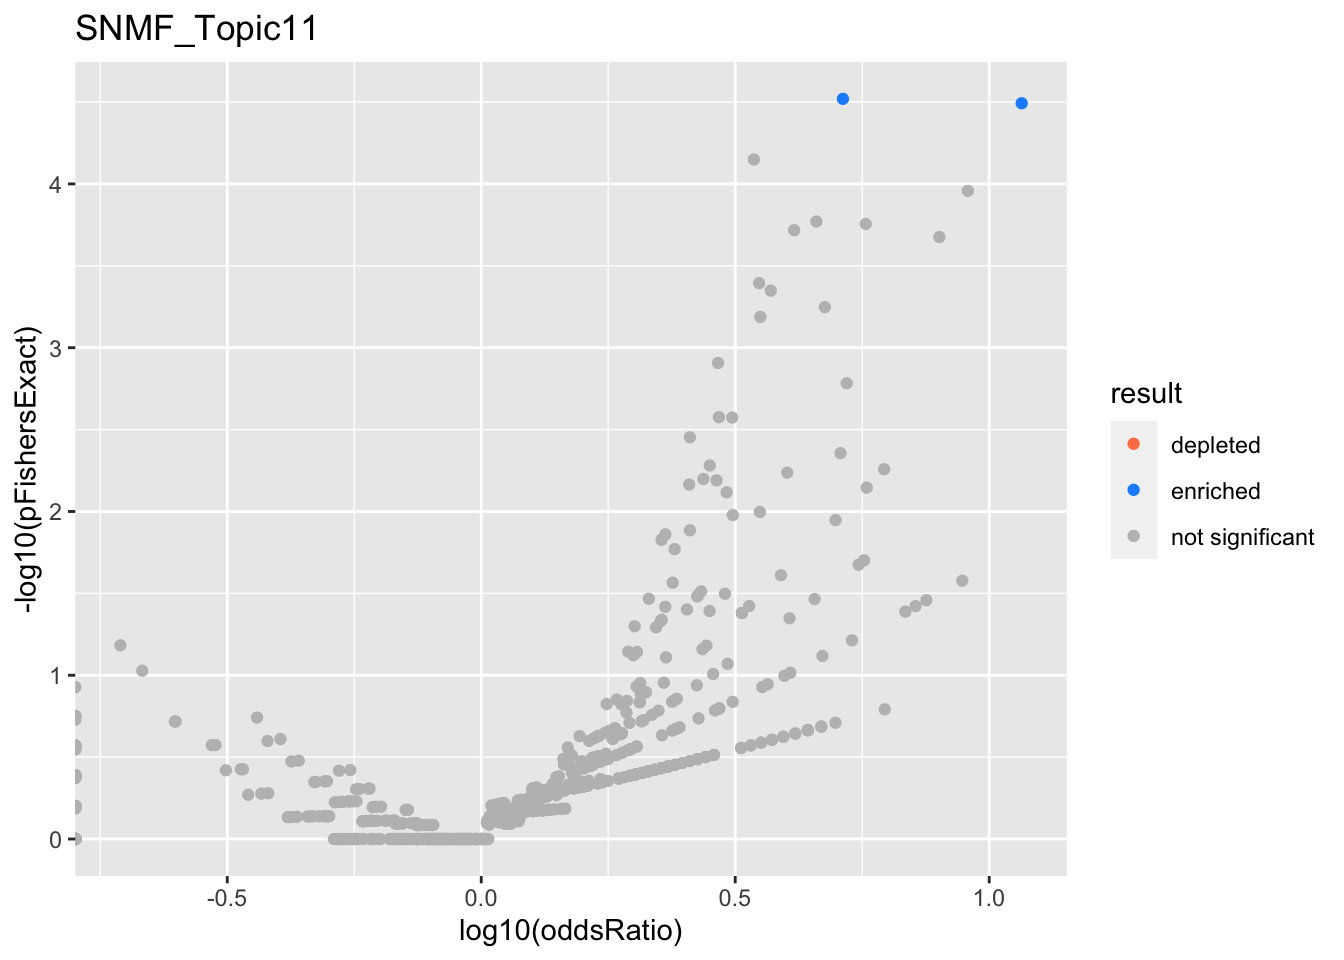
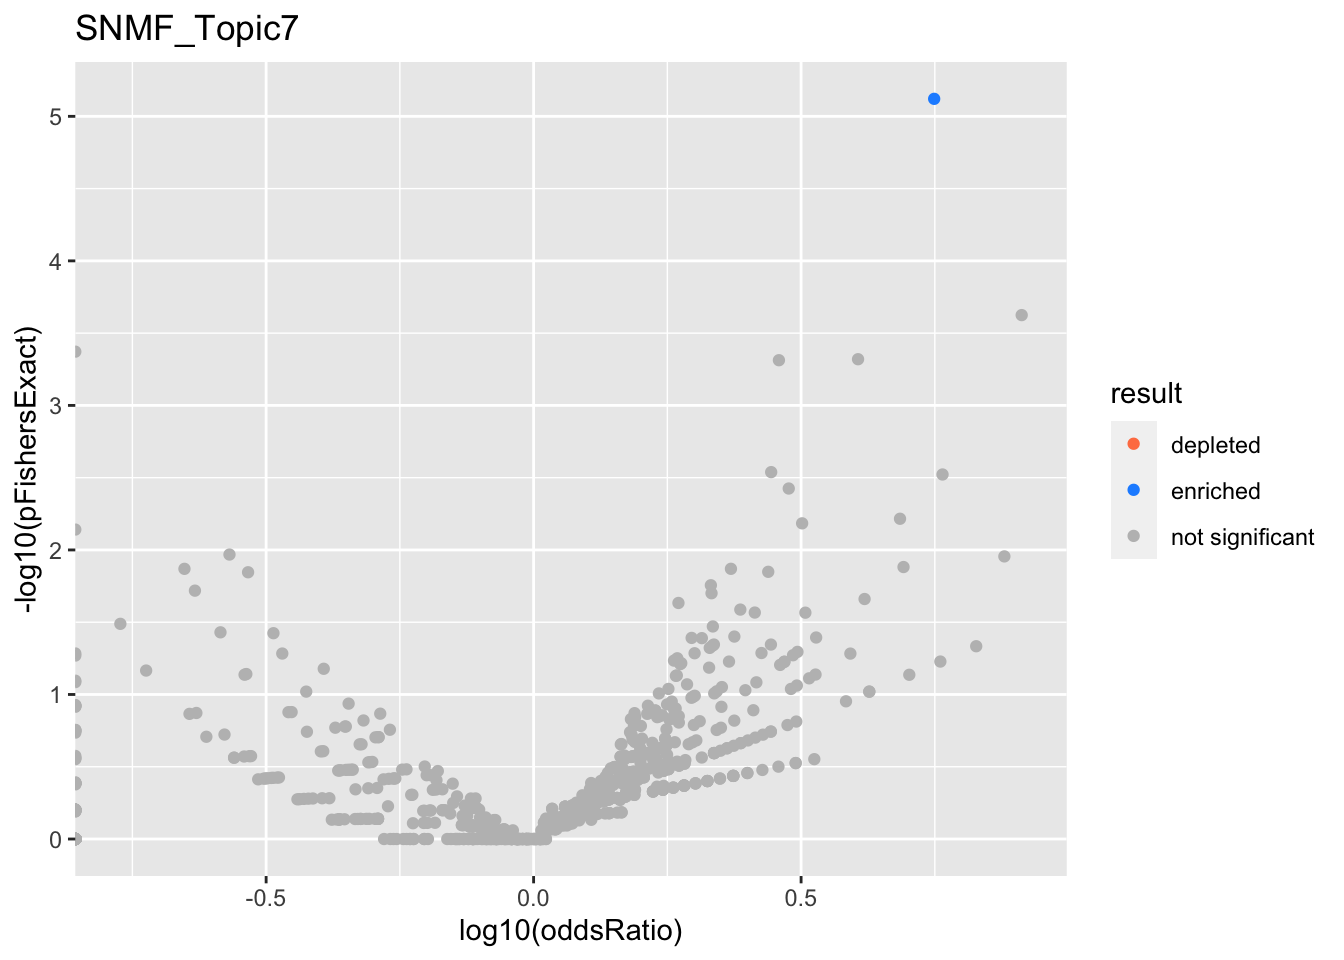
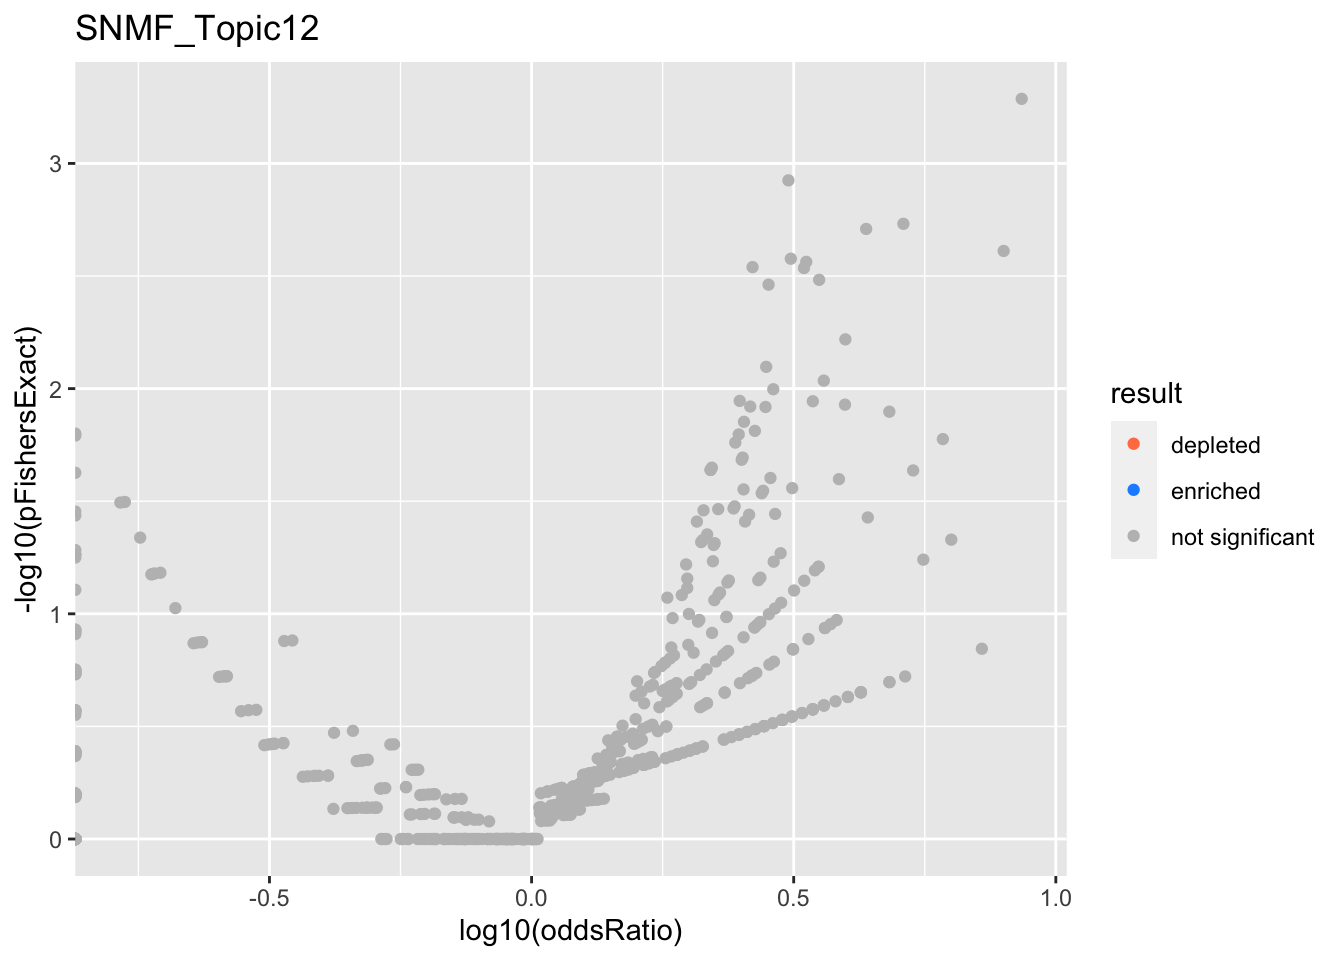
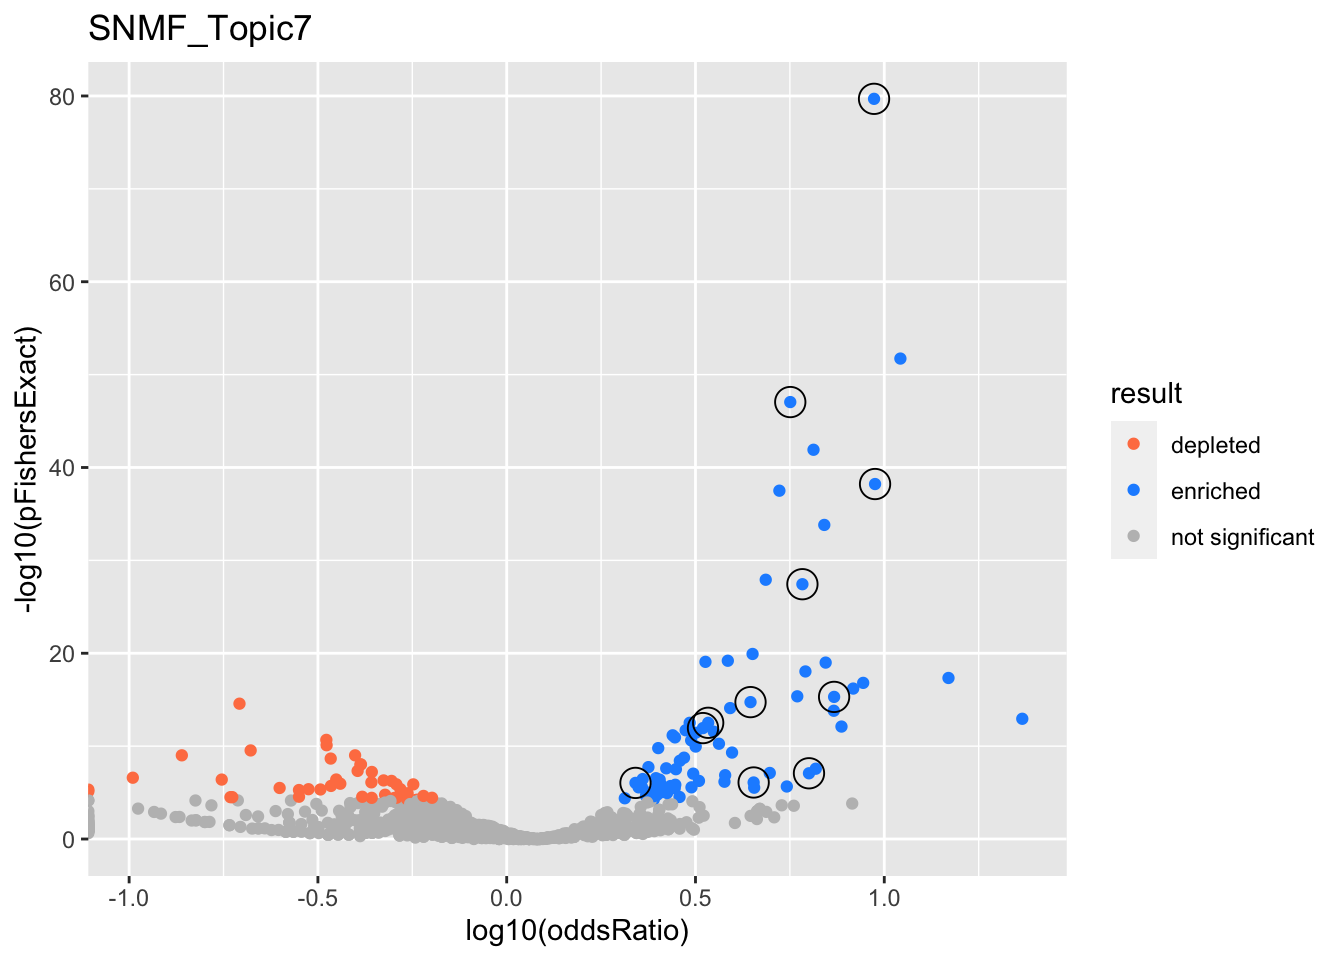
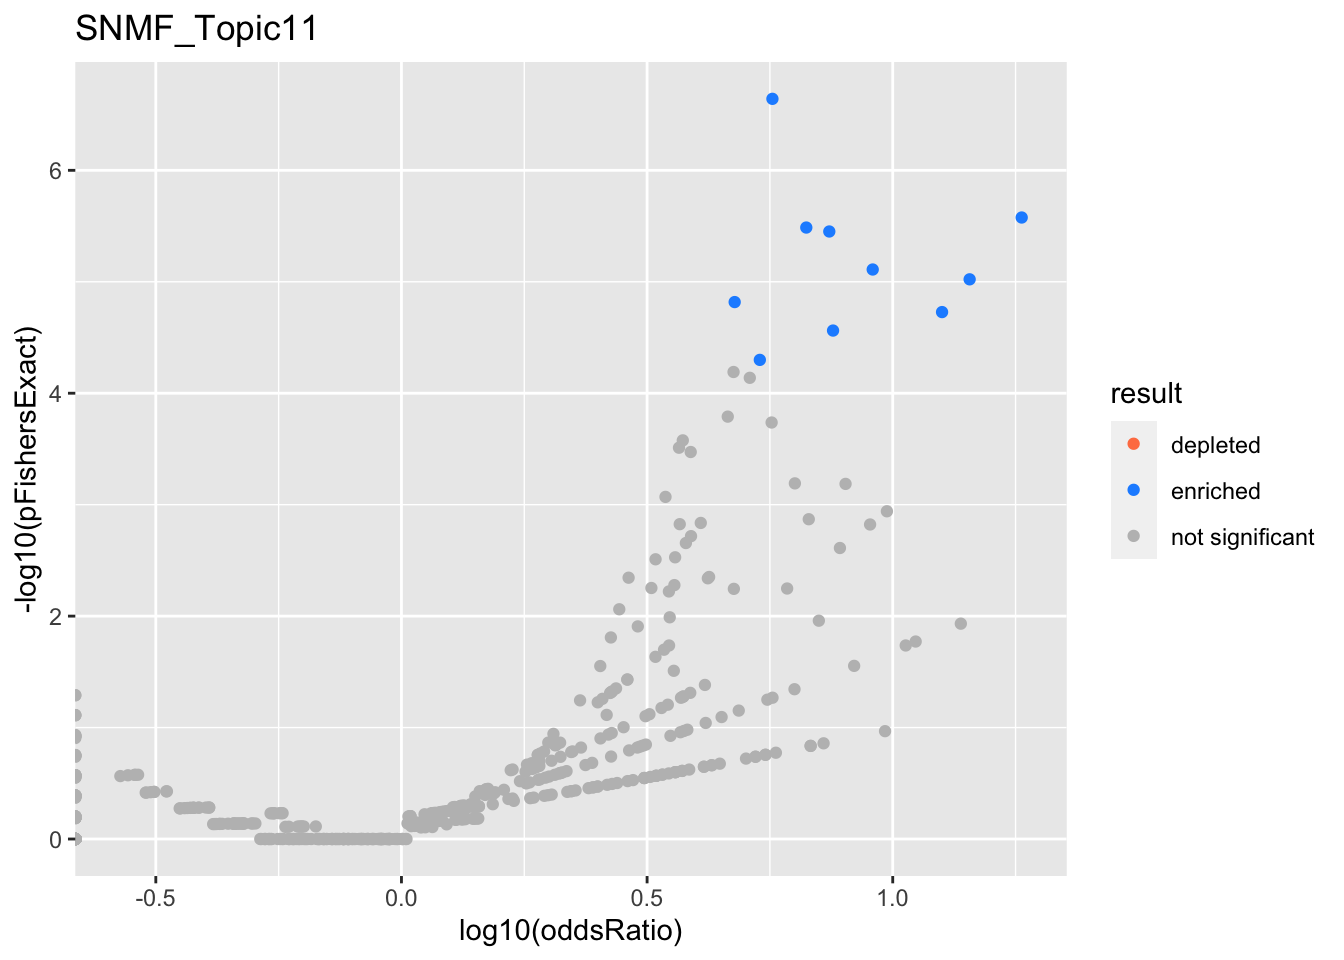
We report gene set enrichment analysis of the topics from Jason’s NMF and SNMF of the Deng et al. data set.
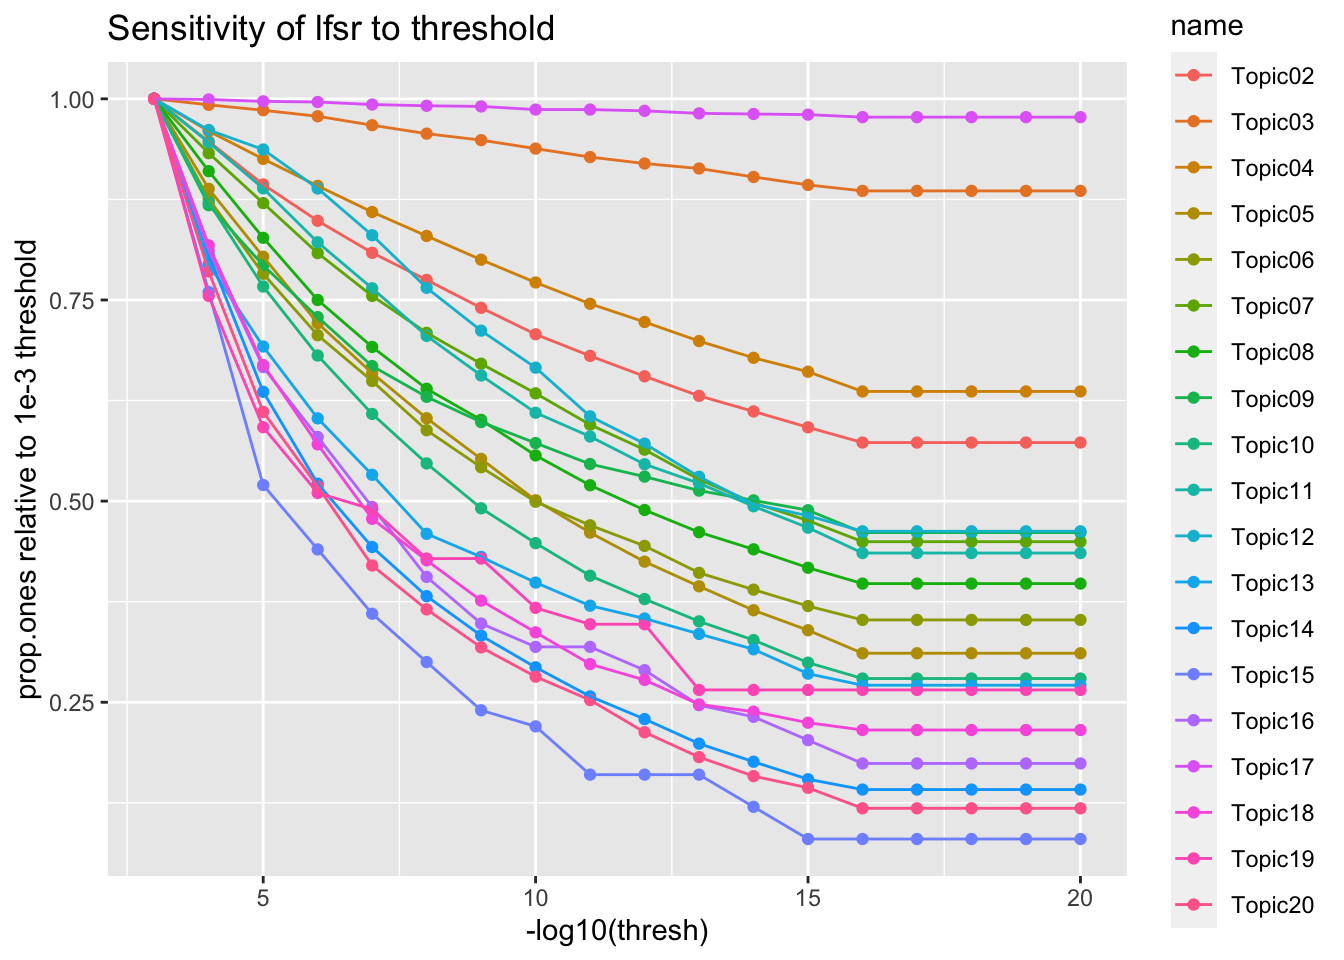
For each topic we construct a binary gene list by thresholding on local false sign rates output from flash. Here, I pick \(lfsr} <- 1e-5\) .
#library(GSEABenchmarkeR)
#library(EnrichmentBrowser)
library(susieR)
library(DT)
library(kableExtra)
library(tidyverse)
library(Matrix)

source('code/load_gene_sets.R')
source('code/utils.R')
source('code/logistic_susie_vb.R')

#source('code/latent_logistic_susie.R')
# load nmf models
nmf <- readRDS('data/deng/nmf.rds')
snmf <- readRDS('data/deng/snmf.rds')
# load genesets
gobp <- loadGeneSetX('geneontology_Biological_Process', min.size=50) # just huge number of gene sets
#gobp_nr <- loadGeneSetX('geneontology_Biological_Process_noRedundant', min.size=1)
gomf <- loadGeneSetX('geneontology_Molecular_Function', min.size=1)
kegg <- loadGeneSetX('pathway_KEGG', min.size=1)
#reactome <- loadGeneSetX('pathway_Reactome', min.size=1)
#wikipathway_cancer <- loadGeneSetX('pathway_Wikipathway_cancer', min.size=1)
#wikipathway <- loadGeneSetX('pathway_Wikipathway', min.size=1)
genesets <- list(
gobp=gobp,
#gobp_nr=gobp_nr,
gomf=gomf,
kegg=kegg
#reactome=reactome,
#wikipathway_cancer=wikipathway_cancer,
#wikipathway=wikipathway
)convert_labels <- function(y, from='SYMBOL', to='ENTREZID'){
hs <- org.Hs.eg.db::org.Hs.eg.db
gene_symbols <- names(y)
if(from == 'SYMBOL'){
gene_symbols <- purrr::map_chr(gene_symbols, toupper)
names(y) <- gene_symbols
}
symbol2entrez <- AnnotationDbi::select(hs, keys=gene_symbols, columns=c(to, from), keytype = from)
symbol2entrez <- symbol2entrez[!duplicated(symbol2entrez[[from]]),]
symbol2entrez <- symbol2entrez[!is.na(symbol2entrez[[to]]),]
symbol2entrez <- symbol2entrez[!is.na(symbol2entrez[[from]]),]
rownames(symbol2entrez) <- symbol2entrez[[from]]
ysub <- y[names(y) %in% symbol2entrez[[from]]]
names(ysub) <- symbol2entrez[names(ysub),][[to]]
return(ysub)
=======
We report gene set enrichment analysis of the topics from Jason’s NMF and SNMF of the Deng et al. data set.
For each topic we construct a binary gene list by thresholding on local false sign rates output from flash. Here, I pick \(lfsr <- 1e-5\) .
library(tidyverse)
library(htmltools)
source('code/utils.R')source('code/load_gene_sets.R')
source('code/load_data.R')
data <- load_deng_topics()
genesets <- load_gene_sets()source('code/logistic_susie_vb.R')
source('code/logistic_susie_veb_boost.R')
source('code/enrichment_pipeline.R')
# fix params
params.genesets <- eval(parse(text=params$genesets))
params.thresh <- eval(parse(text=params$thresh))
params.rerun <- eval(parse(text=params$rerun))
do_logistic_susie_cached = function(data, db, thresh, .sign=c(1, -1), prefix=''){
res <- xfun::cache_rds({
purrr::map_dfr(
names(data),
~do_logistic_susie(.x, db, thresh, genesets, data, .sign=.sign))},
dir = params$cache_dir,
file=paste0(prefix, 'logistic_susie_', db, '_', thresh),
hash = list(data, db, thresh, prefix),
rerun = params.rerun)
>>>>>>> 689eb11fb5dbc931eb8b6b4a5c5efa65bad315c1
}
fits <- map_dfr(params.genesets, ~do_logistic_susie_cached(data, .x, params.thresh))
snmf.data <- data[grep('^SNMF*', names(data))]
positive.fits <- map_dfr(
params.genesets,
~do_logistic_susie_cached(snmf.data, .x, params.thresh, c(1), 'positive_'))Fitting logistic susie...
Experiment = SNMF_Topic2
Database = gobp_nr
thresh = 1e-04Fitting logistic susie...
Experiment = SNMF_Topic3
Database = gobp_nr
thresh = 1e-04Fitting logistic susie...
Experiment = SNMF_Topic4
Database = gobp_nr
thresh = 1e-04Fitting logistic susie...
Experiment = SNMF_Topic5
Database = gobp_nr
thresh = 1e-04Fitting logistic susie...
Experiment = SNMF_Topic6
Database = gobp_nr
thresh = 1e-04Fitting logistic susie...
Experiment = SNMF_Topic7
Database = gobp_nr
thresh = 1e-04Fitting logistic susie...
Experiment = SNMF_Topic8
Database = gobp_nr
thresh = 1e-04Fitting logistic susie...
Experiment = SNMF_Topic9
Database = gobp_nr
thresh = 1e-04Fitting logistic susie...
Experiment = SNMF_Topic10
Database = gobp_nr
thresh = 1e-04Fitting logistic susie...
Experiment = SNMF_Topic11
Database = gobp_nr
thresh = 1e-04Fitting logistic susie...
Experiment = SNMF_Topic12
Database = gobp_nr
thresh = 1e-04Fitting logistic susie...
Experiment = SNMF_Topic13
Database = gobp_nr
thresh = 1e-04Fitting logistic susie...
Experiment = SNMF_Topic14
Database = gobp_nr
thresh = 1e-04Fitting logistic susie...
Experiment = SNMF_Topic15
Database = gobp_nr
thresh = 1e-04Fitting logistic susie...
Experiment = SNMF_Topic16
Database = gobp_nr
thresh = 1e-04Fitting logistic susie...
Experiment = SNMF_Topic17
Database = gobp_nr
thresh = 1e-04Fitting logistic susie...
Experiment = SNMF_Topic18
Database = gobp_nr
thresh = 1e-04Fitting logistic susie...
Experiment = SNMF_Topic19
Database = gobp_nr
thresh = 1e-04Fitting logistic susie...
Experiment = SNMF_Topic20
Database = gobp_nr
thresh = 1e-04negative.fits <- map_dfr(
params.genesets,
~do_logistic_susie_cached(snmf.data, .x, params.thresh, c(-1), 'negative_'))Fitting logistic susie...
Experiment = SNMF_Topic2
Database = gobp_nr
thresh = 1e-04Fitting logistic susie...
Experiment = SNMF_Topic3
Database = gobp_nr
thresh = 1e-04Fitting logistic susie...
Experiment = SNMF_Topic4
Database = gobp_nr
thresh = 1e-04Fitting logistic susie...
Experiment = SNMF_Topic5
Database = gobp_nr
thresh = 1e-04Fitting logistic susie...
Experiment = SNMF_Topic6
Database = gobp_nr
thresh = 1e-04Fitting logistic susie...
Experiment = SNMF_Topic7
Database = gobp_nr
thresh = 1e-04Fitting logistic susie...
Experiment = SNMF_Topic8
Database = gobp_nr
thresh = 1e-04Fitting logistic susie...
Experiment = SNMF_Topic9
Database = gobp_nr
thresh = 1e-04Fitting logistic susie...
Experiment = SNMF_Topic10
Database = gobp_nr
thresh = 1e-04Fitting logistic susie...
Experiment = SNMF_Topic11
Database = gobp_nr
thresh = 1e-04Fitting logistic susie...
Experiment = SNMF_Topic12
Database = gobp_nr
thresh = 1e-04Fitting logistic susie...
Experiment = SNMF_Topic13
Database = gobp_nr
thresh = 1e-04Fitting logistic susie...
Experiment = SNMF_Topic14
Database = gobp_nr
thresh = 1e-04Fitting logistic susie...
Experiment = SNMF_Topic15
Database = gobp_nr
thresh = 1e-04Fitting logistic susie...
Experiment = SNMF_Topic16
Database = gobp_nr
thresh = 1e-04Fitting logistic susie...
Experiment = SNMF_Topic17
Database = gobp_nr
thresh = 1e-04Fitting logistic susie...
Experiment = SNMF_Topic18
Database = gobp_nr
thresh = 1e-04Fitting logistic susie...
Experiment = SNMF_Topic19
Database = gobp_nr
thresh = 1e-04Fitting logistic susie...
Experiment = SNMF_Topic20
Database = gobp_nr
thresh = 1e-04do_ora_cached = function(data, db, thresh, .sign=c(1, -1), prefix=''){
res <- xfun::cache_rds({
purrr::map_dfr(names(data), ~do_ora(.x, db, thresh, genesets, data, .sign=.sign))
},
dir = params$cache_dir,
file=paste0(prefix, 'ora_', db, '_', thresh),
rerun=params.rerun)
}
ora <- map_dfr(params.genesets, ~do_ora_cached(data, .x, params.thresh))
positive.ora <- map_dfr(
params.genesets,
~do_ora_cached(snmf.data, .x, params.thresh, c(1), 'positive_'))
negative.ora <- map_dfr(
params.genesets,
~do_ora_cached(snmf.data, .x, params.thresh, c(-1), 'negative_'))# take credible set summary, return "best" row for each gene set
get_cs_summary_condensed = function(fit){
fit %>%
get_credible_set_summary() %>%
group_by(geneSet) %>%
arrange(desc(alpha)) %>%
filter(row_number() == 1)
}
# generate table for making gene-set plots
get_plot_tbl = function(fits, ora){
res <- fits %>%
left_join(ora) %>%
mutate(
gs_summary = map(fit, get_gene_set_summary),
cs_summary = map(fit, get_cs_summary_condensed),
res = map2(gs_summary, cs_summary, ~ left_join(.x, .y, by='geneSet')),
res = map2(res, ora, ~ possibly(left_join, NULL)(.x, .y))
) %>%
select(-c(fit, susie.args, ora, gs_summary, cs_summary)) %>%
unnest(res)
return(res)
}
# split tibble into a list using 'col'
split_tibble = function(tibble, col = 'col'){
tibble %>% split(., .[, col])
}
# Get summary of credible sets with gene set descriptions
get_table_tbl = function(fits, ora){
res2 <- fits %>%
left_join(ora) %>%
mutate(res = map(fit, get_credible_set_summary)) %>%
mutate(res = map2(res, ora, ~ left_join(.x, .y))) %>%
select(-c(fit, ora)) %>%
unnest(res)
descriptions <- map_dfr(genesets, ~pluck(.x, 'geneSet', 'geneSetDes'))
tbl <- res2 %>%
filter(active_cs) %>%
left_join(descriptions)
tbl_split <- split_tibble(tbl, 'experiment')
html_tables <- map(tbl_split, ~split_tibble(.x, 'db'))
return(html_tables)
}get_ora_enrichments = function(tbl){
tbl %>% mutate(
padj = p.adjust(pFishersExact),
result = case_when(
padj < 0.05 & oddsRatio < 1 ~ 'depleted',
padj < 0.05 & oddsRatio > 1 ~ 'enriched',
TRUE ~ 'not significant'
)
)
}
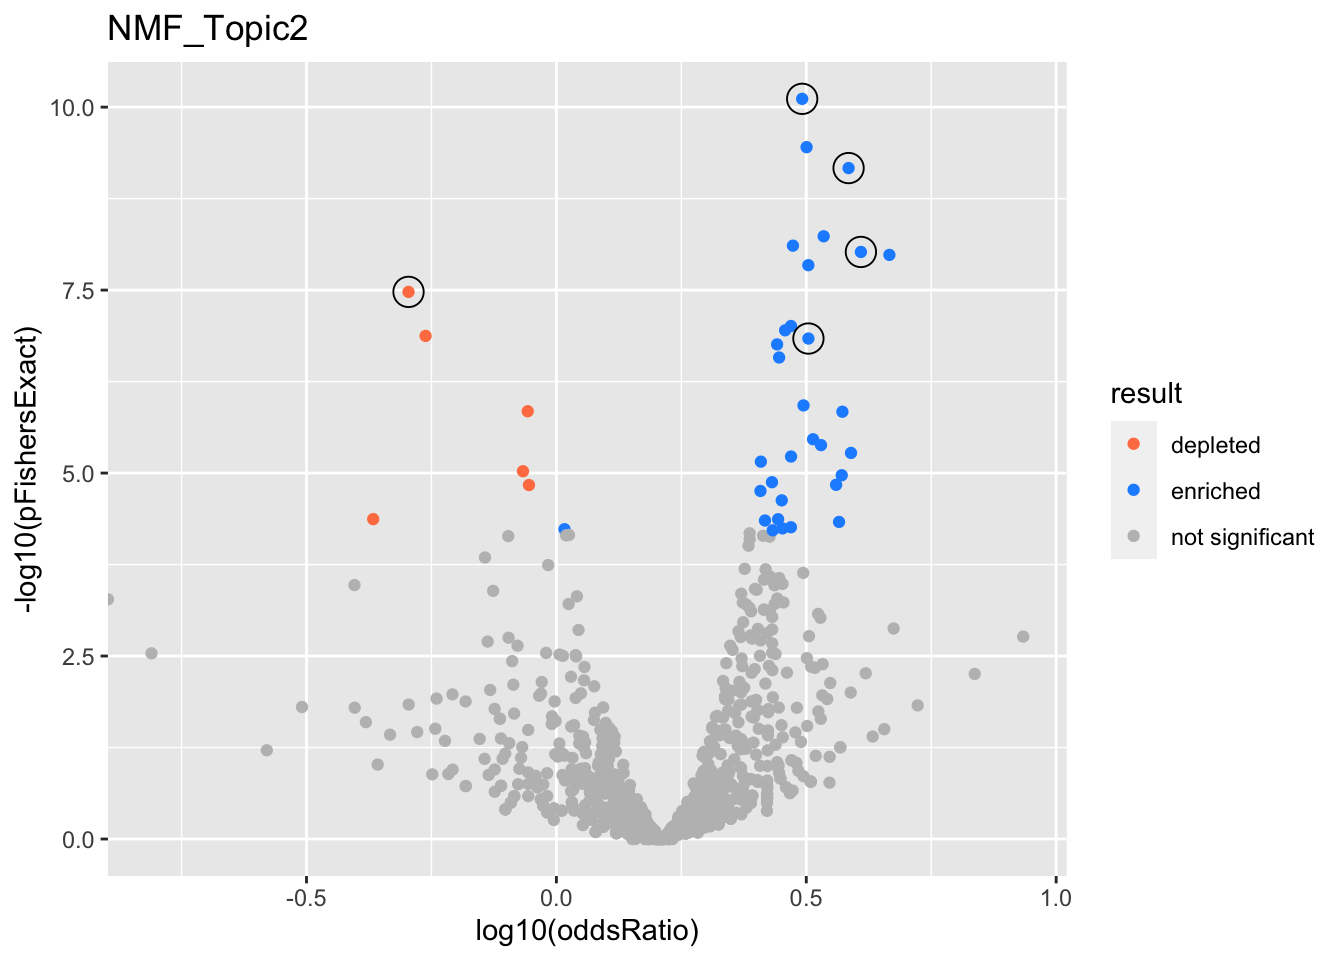
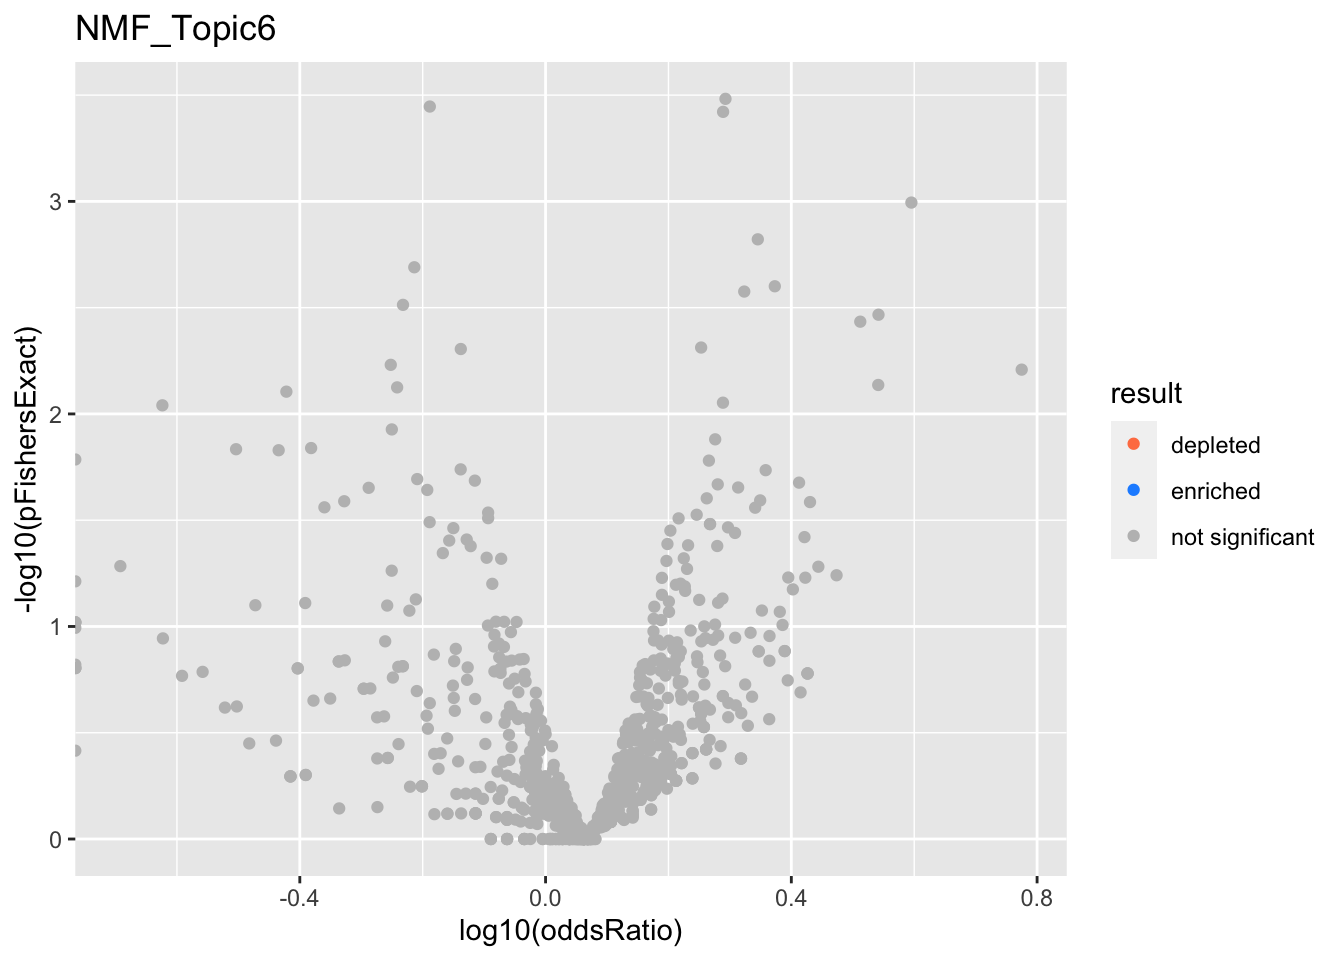
do.volcano = function(res){
res %>%
get_ora_enrichments %>%
ggplot(aes(x=log10(oddsRatio), y=-log10(pFishersExact), color=result)) +
geom_point() +
geom_point(
res %>% filter(in_cs, active_cs),
mapping=aes(x=log10(oddsRatio), y=-log10(pFishersExact)),
color='black', pch=21, size=5) +
scale_color_manual(values = c('depleted' = 'coral',
'enriched' = 'dodgerblue',
'not significant' = 'grey'))
}
NMF
<<<<<<< HEAD
ix  <- order(nmf$fl$pve[-1], decreasing = T) + 1  # exclude first topic
Y <- purrr::map(ix, ~get_y(nmf$fl$L.lfsr[,.x], 1e-5))
names(Y) = paste0('topic_', ix)

nmf.gobp <- xfun::cache_rds({
  susie.args <- list(L=10, maxit=200, verbose=T)
  purrr::map(Y, ~do_logistic_susie(.x, 'gobp', susie.args = susie.args))},
  dir = 'cache/deng_example/', file='nmf.gobp')

nmf.gomf <- xfun::cache_rds({
  susie.args <- list(L=10, maxit=200, verbose=T)
  purrr::map(Y, ~do_logistic_susie(.x, 'gomf', susie.args = susie.args))},
  dir = 'cache/deng_example/', file='nmf.gomf')

nmf.kegg <- xfun::cache_rds({
  susie.args <- list(L=10, maxit=200, verbose=T)
  purrr::map(Y, ~do_logistic_susie(.x, 'kegg', susie.args = susie.args))},
  dir = 'cache/deng_example/', file='nmf.kegg')

nmf.fits <- mget(ls(pattern='^nmf.+'))
names(nmf.fits) <- purrr::map_chr(names(nmf.fits), ~str_split(.x, '\\.')[[1]][2])
Thresholds
mean.gene.prop = function(l){
purrr::map_dbl(3:10, ~get_y(l, 10^(-.x)) %>% mean())
}
=======
Threshold sensitivity
thresh <- map_dbl(1:20, ~10**-.x)
>>>>>>> 689eb11fb5dbc931eb8b6b4a5c5efa65bad315c1
.prop.ones = function(topic){
map_dbl(thresh, ~ prep_binary_data(
genesets[['gobp']], data[[topic]], thresh=.x)$y %>% mean())
}
<<<<<<< HEAD
for(i in 1:length(y.mean.thresh)){
lines(3:10, y.mean.thresh[[i]]/y.mean.thresh[[i]][1])
}library(htmltools)
=======
prop.ones <- map_dfc(names(data[grep('^NMF*', names(data))]), ~.prop.ones(.x))
new.names = paste0('Topic', str_pad(2:20, 2, pad='0'))
colnames(prop.ones) <- new.names
prop.ones <- prop.ones %>% mutate(thresh = thresh)
prop.ones %>%
pivot_longer(one_of(new.names)) %>%
filter(thresh <= 1e-3) %>%
group_by(name) %>%
mutate(value = value / (sort(value, decreasing = T)[1])) %>%
ggplot(aes(x=-log10(thresh), y=value, color=name)) +
geom_point() + geom_line() +
labs(
y = 'prop.ones relative to 1e-3 threshold',
title = 'Sensitivity of lfsr to threshold'
)
Past versions of threshold.sensitivity-1.png
Version
Author
Date
a102c2d
karltayeb
2022-04-13
72fad28
karltayeb
2022-04-09
Glossary
alpha is the posterior probability of SuSiE including this gene set in this component which is different from PIP (probability of SuSiE including this gene set in ANY component)beta posterior mean/standard error of posterior mean for effect size. Standard errors are likely too small.oddsRatio, pHypergeometric, pFishersExact construct a contingency table (gene list membersip) x (gene set membership), estimate the oddsRatio gives the odds of being in the gene list conditional on being in the gene set / odds of being in the gene list conditional on NOT being in the gene set. pHypergeometric and pFishersExact are pvalues from 1 and 2 sided test respectively.
res <- fits %>%
filter(str_detect(experiment, '^NMF*')) %>%
get_plot_tbl(., ora)
>>>>>>> 689eb11fb5dbc931eb8b6b4a5c5efa65bad315c1
html_tables <- fits %>%
filter(str_detect(experiment, '^NMF*')) %>%
get_table_tbl(., ora)
experiments <- unique(res$experiment)
for (i in 1:length(experiments)){
this_experiment <- experiments[i]
cat("\n")
cat("###", this_experiment, "\n") # Create second level headings with the names.
# print volcano plot
p <- do.volcano(res %>% filter(experiment == this_experiment)) +
labs(title=this_experiment)
print(p)
cat("\n\n")
# print table
for(db in names(html_tables[[this_experiment]])){
cat("####", db, "\n") # Create second level headings with the names.
to_print <- html_tables[[this_experiment]][[db]] %>% distinct()
to_print %>% report_susie_credible_sets() %>% htmltools::HTML() %>% print()
cat("\n")
}}
NMF_Topic2
Past versions of nmf.results-1.png
Version
Author
Date
a102c2d
karltayeb
2022-04-13
gobp_nr
geneSet
description
alpha
beta
beta.se
pHypergeometric
pFishersExact
overlap
geneSetSize
oddsRatio
L1
GO:0044772
mitotic cell cycle phase transition
0.97
0.518
0.0949
4.1e-11
7.71e-11
231
435
3.1
GO:0048285
organelle fission
0.0136
0.47
0.102
1.91e-10
3.52e-10
202
376
3.17
GO:1901987
regulation of cell cycle phase transition
0.0052
0.469
0.107
5.79e-08
9.78e-08
176
338
2.95
GO:0007059
chromosome segregation
0.00303
0.52
0.123
3.27e-09
5.82e-09
142
254
3.43
L3
GO:0040029
regulation of gene expression, epigenetic
0.937
0.816
0.137
5e-10
6.8e-10
124
211
3.84
GO:0016458
gene silencing
0.0624
0.853
0.156
6.49e-09
9.52e-09
97
161
4.07
L4
GO:0006399
tRNA metabolic process
0.957
-1.02
0.185
1
3.34e-08
22
136
0.506
GO:0034470
ncRNA processing
0.0394
-0.59
0.118
1
1.43e-06
76
304
0.876
L5
GO:0070646
protein modification by small protein removal
0.954
0.619
0.125
9.91e-08
1.45e-07
135
249
3.19
GO:0000209
protein polyubiquitination
0.0048
0.487
0.131
7.08e-07
1.19e-06
123
229
3.12
GO:0016311
dephosphorylation
0.0015
0.353
0.102
9.77e-06
1.76e-05
187
385
2.56
GO:0016569
covalent chromatin modification
0.00148
0.352
0.101
1.54e-07
2.63e-07
196
387
2.79
GO:0030522
intracellular receptor signaling pathway
0.00138
0.429
0.127
2.37e-05
4.27e-05
124
244
2.78
GO:0140053
mitochondrial gene expression
0.00137
-0.556
0.169
1
1.34e-07
24
139
0.547
GO:0071166
ribonucleoprotein complex localization
0.00127
0.581
0.178
1.03e-05
1.45e-05
68
118
3.63
GO:0009755
hormone-mediated signaling pathway
0.00101
0.467
0.143
3.3e-05
5.5e-05
99
189
2.95
GO:0007265
Ras protein signal transduction
0.000958
0.345
0.103
6.18e-08
1.12e-07
191
372
2.87
GO:0018210
peptidyl-threonine modification
0.000929
0.603
0.192
3.48e-05
4.65e-05
58
100
3.68
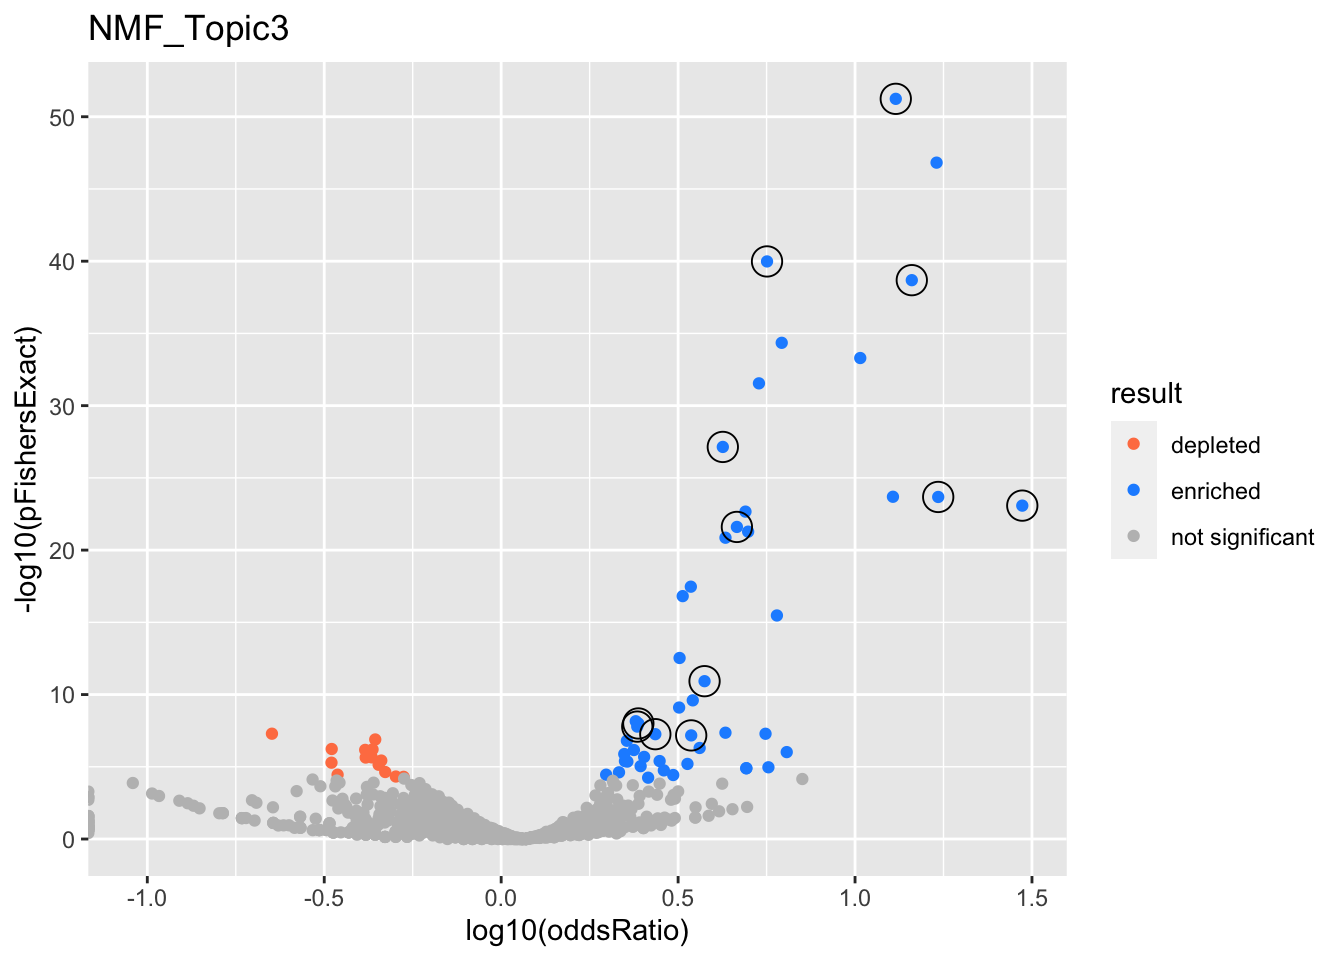
NMF_Topic3
Past versions of nmf.results-2.png
Version
Author
Date
a102c2d
karltayeb
2022-04-13
gobp_nr
geneSet
description
alpha
beta
beta.se
pHypergeometric
pFishersExact
overlap
geneSetSize
oddsRatio
L1
GO:0006413
translational initiation
1
1.85
0.156
5.76e-52
5.76e-52
112
177
13
L10
GO:0070646
protein modification by small protein removal
1
0.922
0.132
3.23e-08
5.52e-08
68
249
2.73
L2
GO:0006414
translational elongation
1
2.67
0.187
2.06e-39
2.06e-39
80
121
14.5
L3
GO:0033108
mitochondrial respiratory chain complex assembly
0.903
2.27
0.262
2.09e-24
2.09e-24
45
64
17.2
GO:0010257
NADH dehydrogenase complex assembly
0.0973
2.59
0.309
8.33e-24
8.33e-24
37
46
29.7
L4
GO:0006605
protein targeting
1
1.2
0.109
1.04e-40
1.04e-40
154
364
5.64
L5
GO:0009123
nucleoside monophosphate metabolic process
0.985
1.2
0.13
2.49e-22
2.49e-22
98
255
4.64
GO:0009141
nucleoside triphosphate metabolic process
0.0145
1.18
0.134
2.16e-23
2.16e-23
97
244
4.9
L6
GO:0022613
ribonucleoprotein complex biogenesis
1
0.96
0.107
7.21e-28
7.21e-28
140
391
4.23
L7
GO:0006457
protein folding
1
1.16
0.154
1.08e-11
1.18e-11
61
179
3.76
L8
GO:0036230
granulocyte activation
0.52
0.798
0.108
7.46e-09
1e-08
96
384
2.44
GO:0002446
neutrophil mediated immunity
0.48
0.796
0.108
9.89e-09
1.65e-08
96
386
2.42
L9
GO:0006399
tRNA metabolic process
1
1.17
0.177
4.79e-08
6.72e-08
44
136
3.44
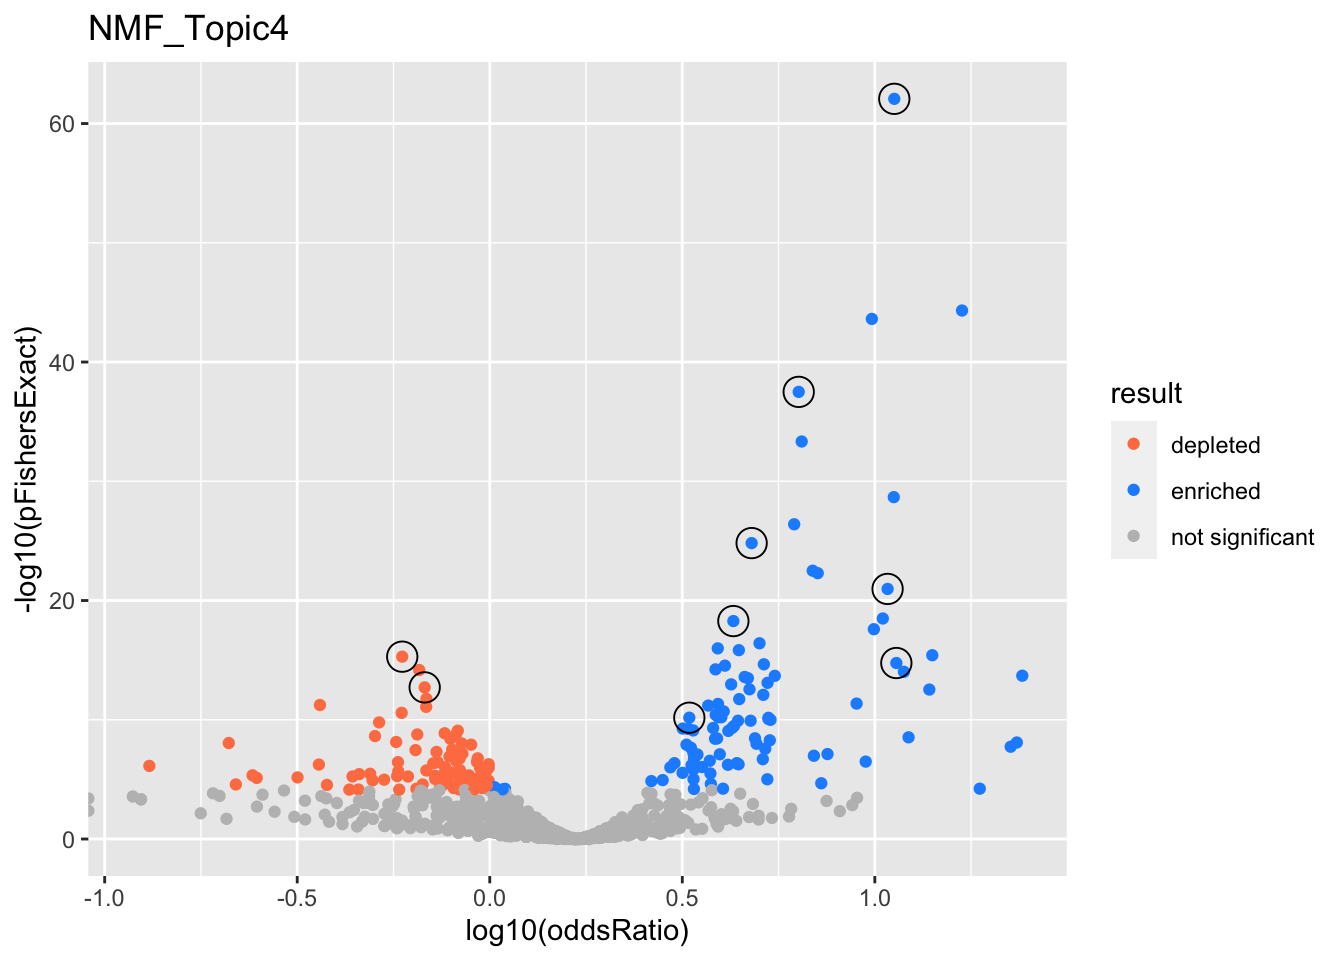
NMF_Topic4
Past versions of nmf.results-3.png
Version
Author
Date
a102c2d
karltayeb
2022-04-13
gobp_nr
geneSet
description
alpha
beta
beta.se
pHypergeometric
pFishersExact
overlap
geneSetSize
oddsRatio
L1
GO:0022613
ribonucleoprotein complex biogenesis
1
1.57
0.111
5.24e-63
8.47e-63
316
391
11.2
L2
GO:0044772
mitotic cell cycle phase transition
1
1.07
0.0979
8.84e-26
1.53e-25
281
435
4.79
L3
GO:0006397
mRNA processing
0.991
1.02
0.102
2.68e-38
3.18e-38
300
425
6.34
L4
GO:0043062
extracellular structure organization
1
-0.871
0.119
1
5.11e-16
63
325
0.593
L5
GO:0016569
covalent chromatin modification
1
0.865
0.103
3.74e-19
5.28e-19
241
387
4.29
L6
GO:0070972
protein localization to endoplasmic reticulum
0.996
1.69
0.191
9.03e-22
1.07e-21
106
131
10.8
L7
GO:0061919
process utilizing autophagic mechanism
1
0.75
0.1
3.83e-11
6.73e-11
226
403
3.3
L8
GO:0034765
regulation of ion transmembrane transport
0.992
-0.865
0.116
1
1.92e-13
73
339
0.678
L9
GO:0098781
ncRNA transcription
0.99
1.7
0.233
1.08e-15
1.74e-15
72
88
11.4
GO:0016073
snRNA metabolic process
0.0101
1.6
0.242
2.81e-16
3.88e-16
67
79
14.1
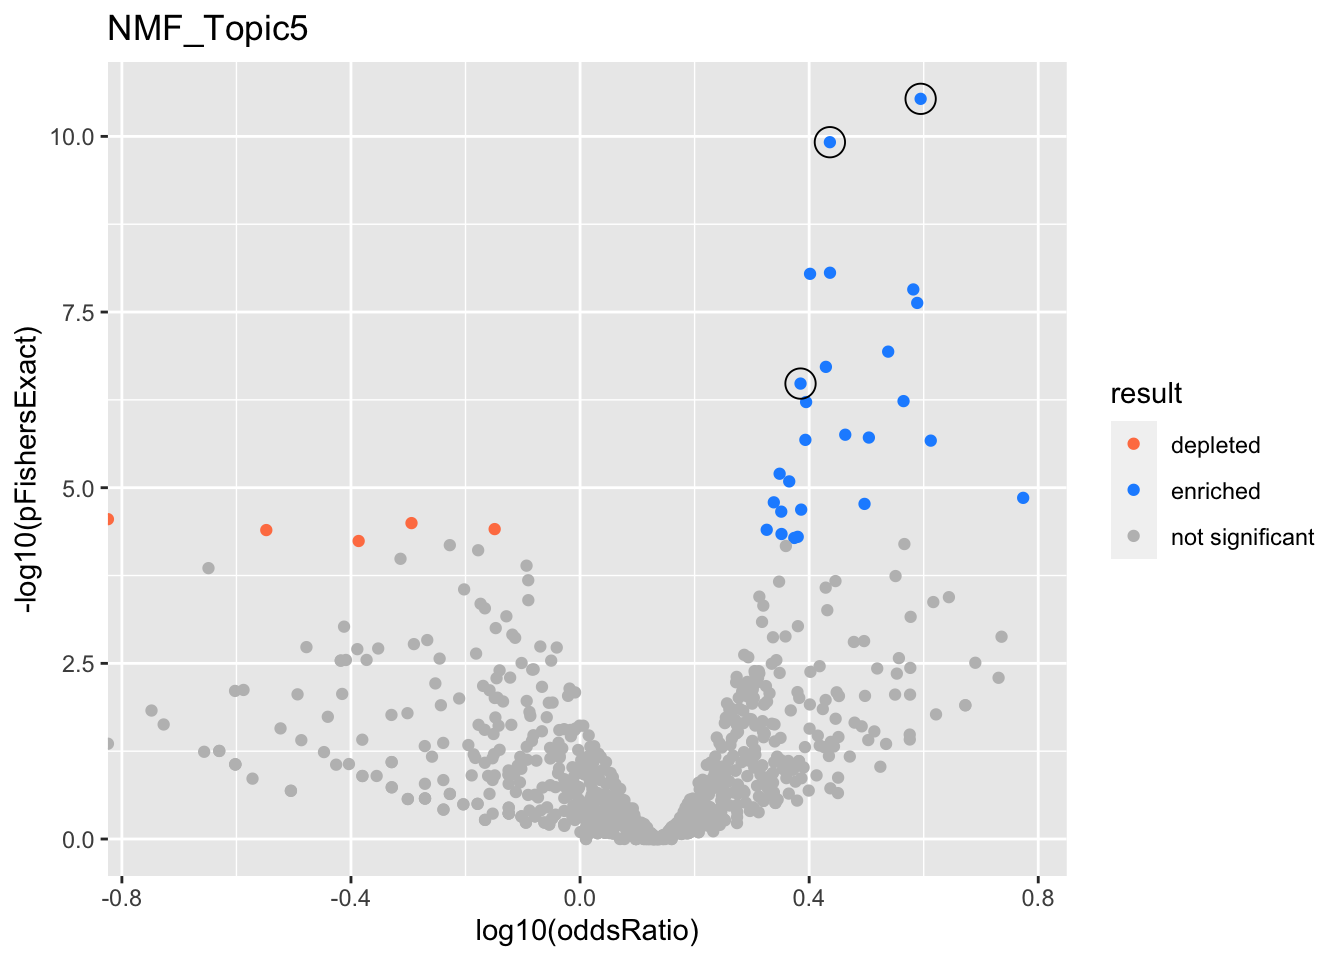
NMF_Topic5
Past versions of nmf.results-4.png
Version
Author
Date
a102c2d
karltayeb
2022-04-13
gobp_nr
geneSet
description
alpha
beta
beta.se
pHypergeometric
pFishersExact
overlap
geneSetSize
oddsRatio
L1
GO:0016197
endosomal transport
0.981
0.86
0.152
1.79e-11
2.92e-11
86
170
3.93
GO:0016482
cytosolic transport
0.016
0.854
0.176
1.24e-08
1.51e-08
64
128
3.82
L2
GO:0061919
process utilizing autophagic mechanism
0.996
0.555
0.0992
7.39e-11
1.21e-10
166
403
2.73
L3
GO:0006091
generation of precursor metabolites and energy
0.989
0.566
0.103
2.31e-07
3.3e-07
143
371
2.43
GO:0009123
nucleoside monophosphate metabolic process
0.00462
0.544
0.125
1.16e-05
2.05e-05
99
255
2.43
NMF_Topic6
Past versions of nmf.results-5.png
Version
Author
Date
a102c2d
karltayeb
2022-04-13
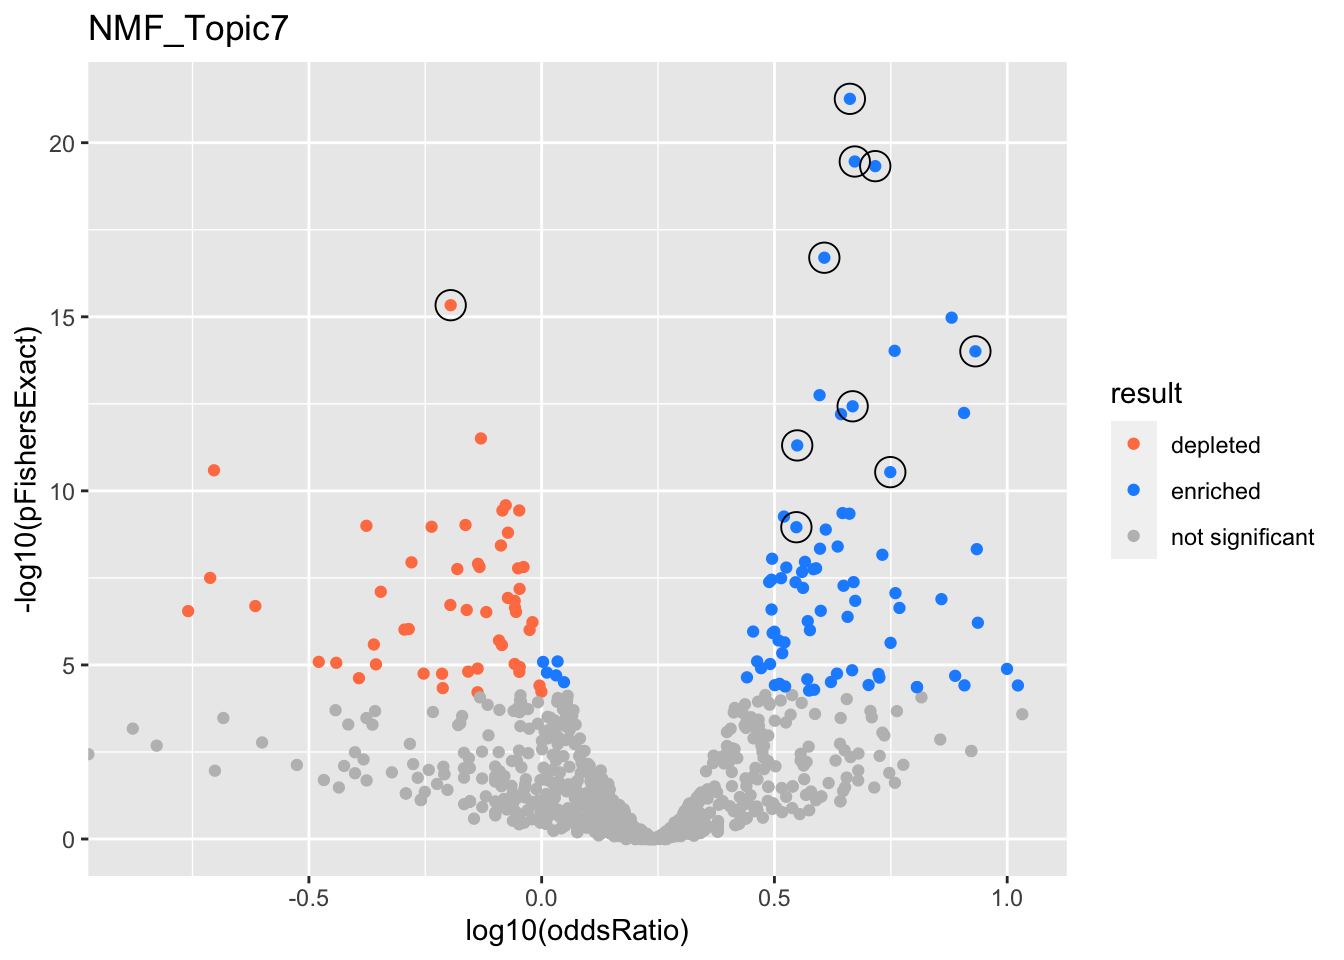
NMF_Topic7
Past versions of nmf.results-6.png
Version
Author
Date
a102c2d
karltayeb
2022-04-13
gobp_nr
geneSet
description
alpha
beta
beta.se
pHypergeometric
pFishersExact
overlap
geneSetSize
oddsRatio
L1
GO:0006397
mRNA processing
0.902
0.985
0.0984
4.02e-22
5.49e-22
275
425
4.59
GO:0008380
RNA splicing
0.0984
1.03
0.106
2.57e-20
3.47e-20
240
367
4.71
L10
GO:0048193
Golgi vesicle transport
1
0.765
0.113
5.69e-10
1.11e-09
185
314
3.53
L2
GO:0034470
ncRNA processing
1
1.09
0.117
2.65e-20
4.71e-20
206
304
5.21
L3
GO:0034765
regulation of ion transmembrane transport
1
-0.961
0.116
1
4.65e-16
72
339
0.638
L4
GO:0061919
process utilizing autophagic mechanism
1
0.757
0.1
2.65e-12
4.95e-12
237
403
3.54
L5
GO:0044772
mitotic cell cycle phase transition
0.987
0.663
0.0971
1.12e-17
2.01e-17
269
435
4.05
GO:0044839
cell cycle G2/M phase transition
0.00606
0.885
0.148
6.1e-15
9.5e-15
129
184
5.73
L6
GO:0031023
microtubule organizing center organization
1
1.36
0.199
5.23e-15
9.82e-15
88
113
8.55
L7
GO:0140053
mitochondrial gene expression
0.999
1.12
0.174
2.21e-11
2.9e-11
97
139
5.61
L8
GO:0006260
DNA replication
0.984
0.877
0.133
2.08e-13
3.72e-13
152
232
4.66
GO:0006289
nucleotide-excision repair
0.00808
1.12
0.194
3.05e-13
5.79e-13
80
104
8.08
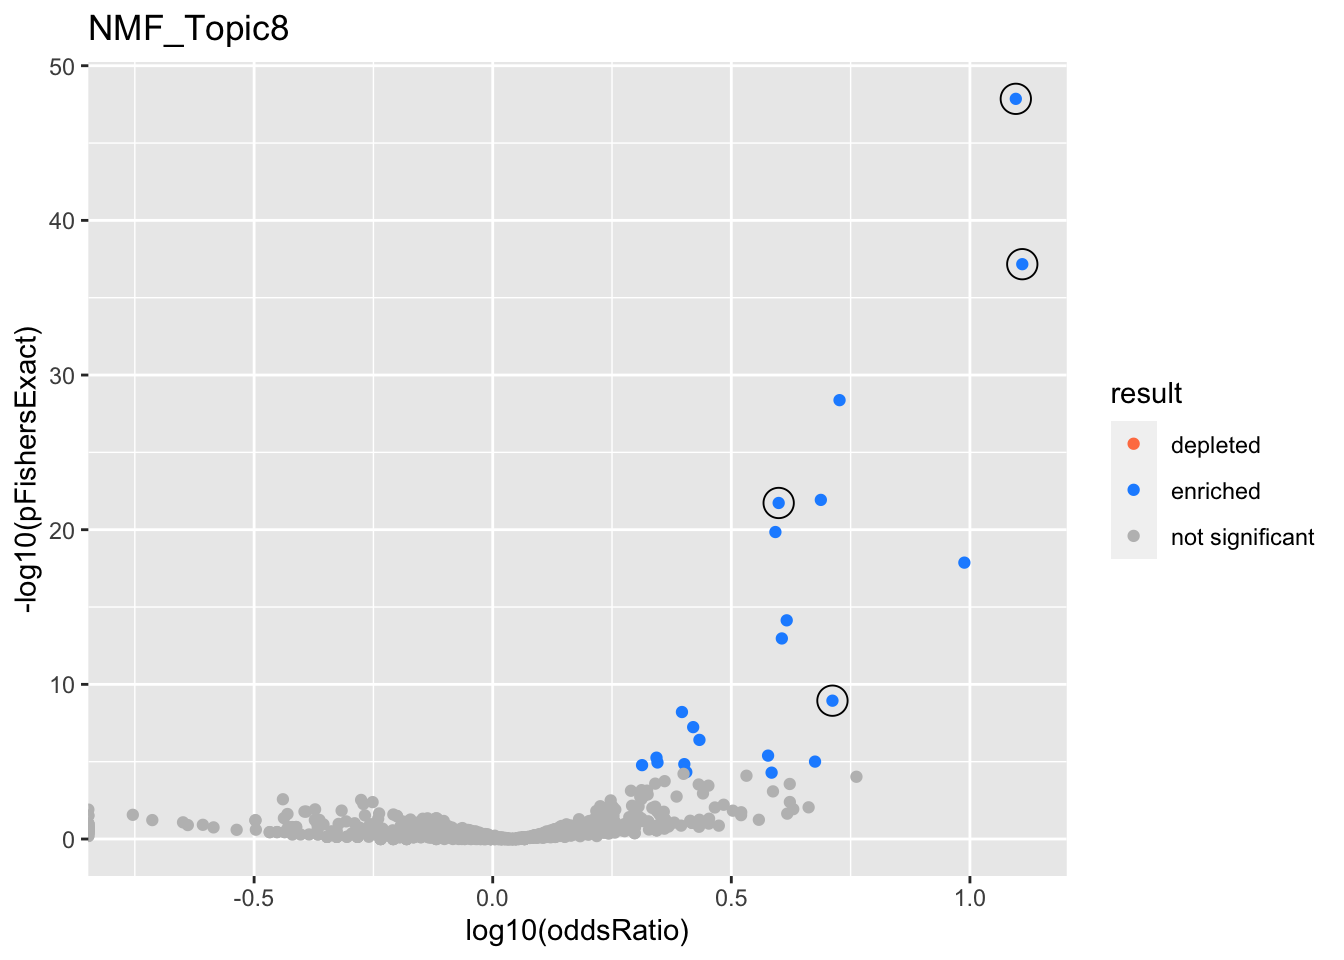
NMF_Topic8
Past versions of nmf.results-7.png
Version
Author
Date
a102c2d
karltayeb
2022-04-13
gobp_nr
geneSet
description
alpha
beta
beta.se
pHypergeometric
pFishersExact
overlap
geneSetSize
oddsRatio
L1
GO:0006413
translational initiation
1
1.59
0.154
1.39e-48
1.39e-48
95
177
12.5
L2
GO:0070972
protein localization to endoplasmic reticulum
1
1.34
0.181
6.8e-38
6.8e-38
72
131
12.9
L3
GO:1990823
response to leukemia inhibitory factor
1
1.55
0.216
1.14e-09
1.14e-09
30
89
5.15
L4
GO:0022613
ribonucleoprotein complex biogenesis
1
0.844
0.108
1.87e-22
1.87e-22
106
391
3.97
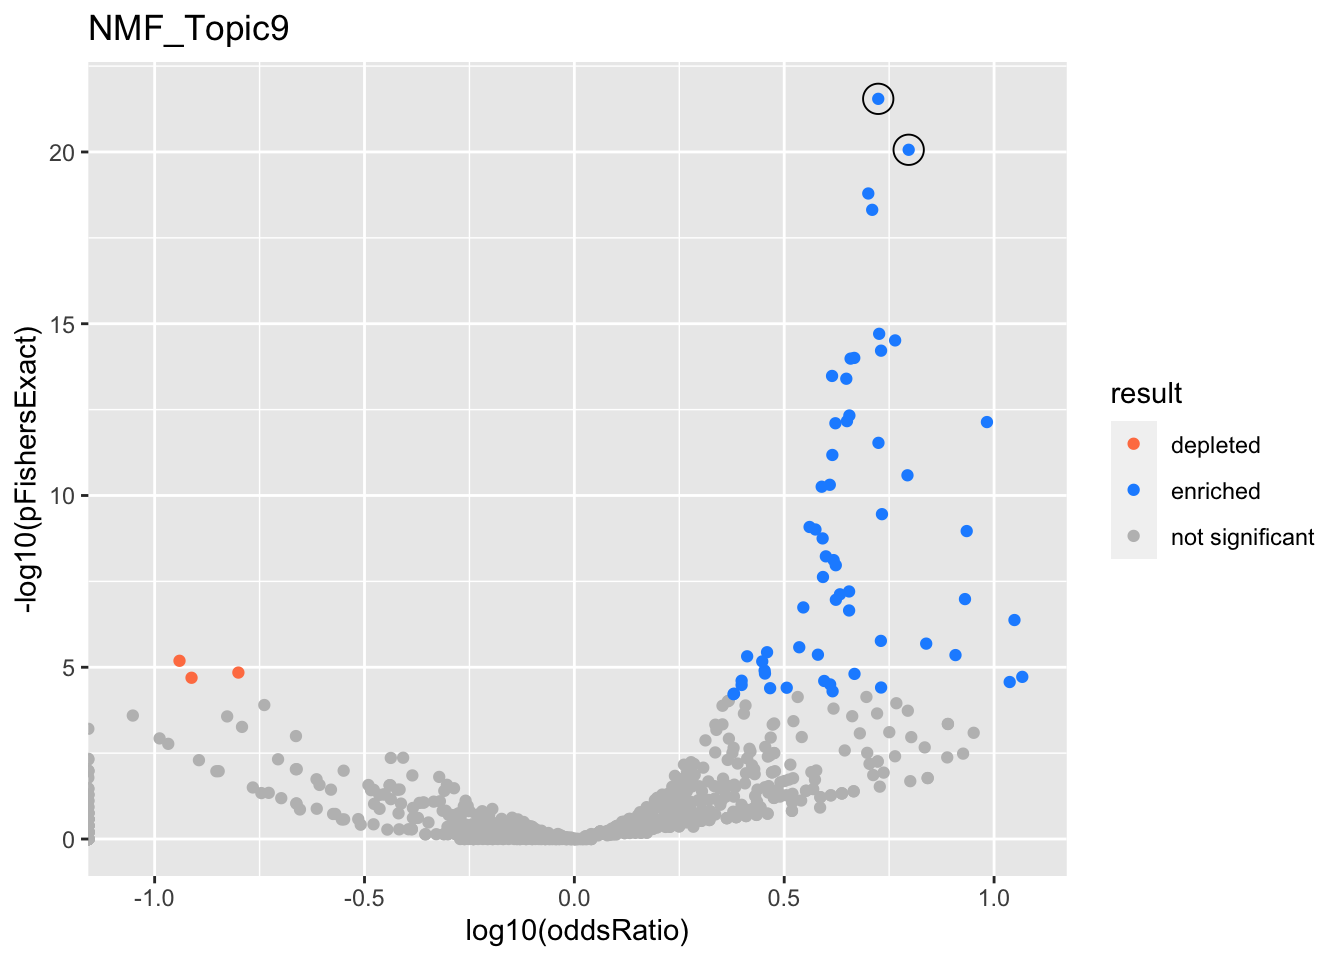
NMF_Topic9
Past versions of nmf.results-8.png
Version
Author
Date
a102c2d
karltayeb
2022-04-13
gobp_nr
geneSet
description
alpha
beta
beta.se
pHypergeometric
pFishersExact
overlap
geneSetSize
oddsRatio
L1
GO:0002250
adaptive immune response
1
1.19
0.134
8.63e-21
8.63e-21
52
263
6.26
L2
GO:0002521
leukocyte differentiation
1
1.16
0.112
2.84e-22
2.84e-22
66
390
5.3
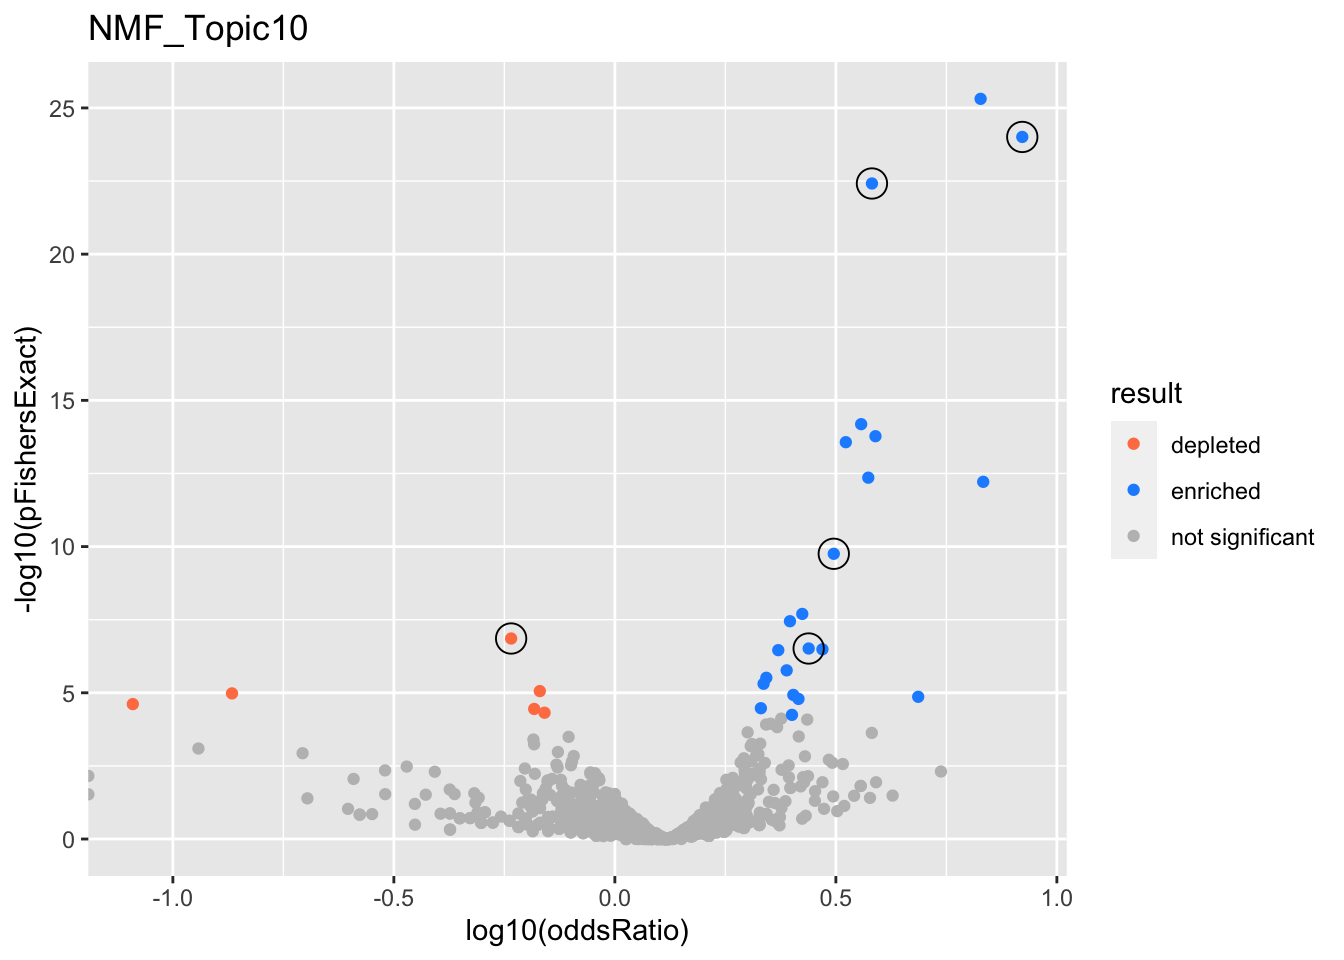
NMF_Topic10
Past versions of nmf.results-9.png
Version
Author
Date
a102c2d
karltayeb
2022-04-13
gobp_nr
geneSet
description
alpha
beta
beta.se
pHypergeometric
pFishersExact
overlap
geneSetSize
oddsRatio
L1
GO:0070972
protein localization to endoplasmic reticulum
1
1.56
0.178
9.82e-25
9.82e-25
86
131
8.35
L2
GO:0022613
ribonucleoprotein complex biogenesis
1
0.886
0.102
3.15e-23
3.83e-23
180
391
3.82
L3
GO:0070646
protein modification by small protein removal
1
0.827
0.126
1.03e-10
1.76e-10
104
249
3.13
L4
GO:0044282
small molecule catabolic process
0.999
-0.69
0.122
1
1.39e-07
41
336
0.582
L5
GO:0034504
protein localization to nucleus
0.954
0.642
0.132
1.81e-07
3.06e-07
88
227
2.74
GO:0006383
transcription by RNA polymerase III
0.00333
0.905
0.276
1.06e-05
1.37e-05
25
47
4.86
GO:0006457
protein folding
0.00246
0.514
0.153
4e-05
5.69e-05
66
179
2.52
GO:0006413
translational initiation
0.00194
0.5
0.152
4.89e-26
4.89e-26
107
177
6.72
GO:0071824
protein-DNA complex subunit organization
0.00188
0.498
0.151
2.59e-07
3.25e-07
73
180
2.95
GO:0016569
covalent chromatin modification
0.0017
0.353
0.105
2.14e-07
3.48e-07
135
387
2.34
GO:0018205
peptidyl-lysine modification
0.00162
0.404
0.122
1.22e-06
1.71e-06
102
283
2.45
GO:0006970
response to osmotic stress
0.000875
0.739
0.259
0.00147
0.00246
24
57
3.1
GO:0040029
regulation of gene expression, epigenetic
0.000865
0.431
0.141
7.41e-06
1.18e-05
78
211
2.53
GO:0007200
phospholipase C-activating G protein-coupled receptor signaling pathway
0.000804
-0.704
0.247
1
1.05e-05
2
64
0.136
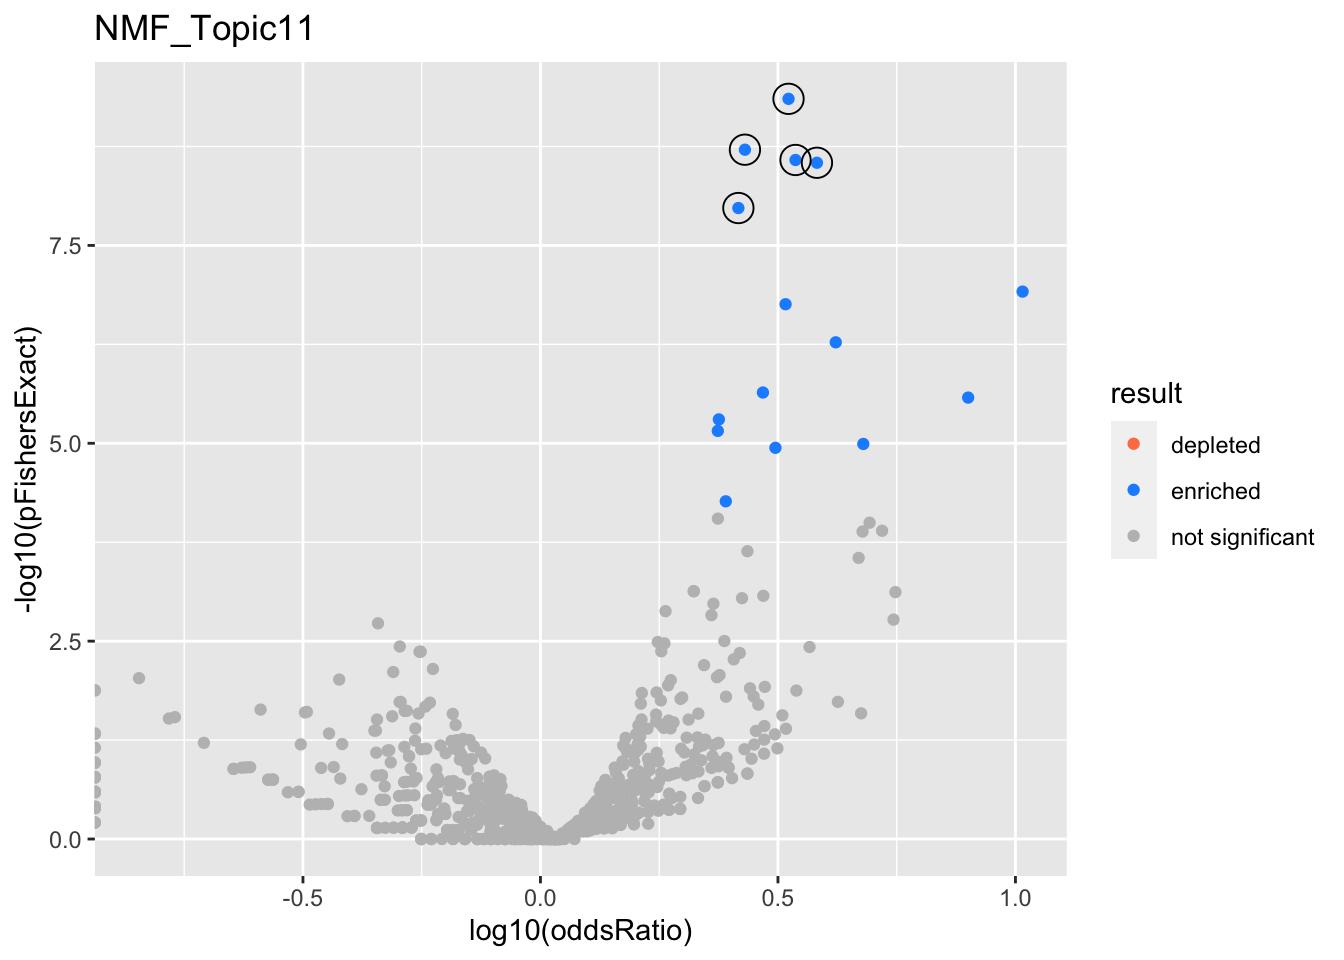
NMF_Topic11
Past versions of nmf.results-10.png
Version
Author
Date
a102c2d
karltayeb
2022-04-13
gobp_nr
geneSet
description
alpha
beta
beta.se
pHypergeometric
pFishersExact
overlap
geneSetSize
oddsRatio
L1
GO:0034976
response to endoplasmic reticulum stress
1
1.04
0.138
4.45e-10
4.45e-10
51
239
3.33
L2
GO:0002446
neutrophil mediated immunity
0.881
0.859
0.111
1.47e-09
1.95e-09
69
386
2.69
GO:0036230
granulocyte activation
0.119
0.833
0.111
7.16e-09
1.07e-08
67
384
2.61
L3
GO:0070085
glycosylation
0.999
0.893
0.15
2.63e-09
2.63e-09
44
200
3.44
L4
GO:0006643
membrane lipid metabolic process
0.999
0.984
0.167
2.85e-09
2.85e-09
38
159
3.82
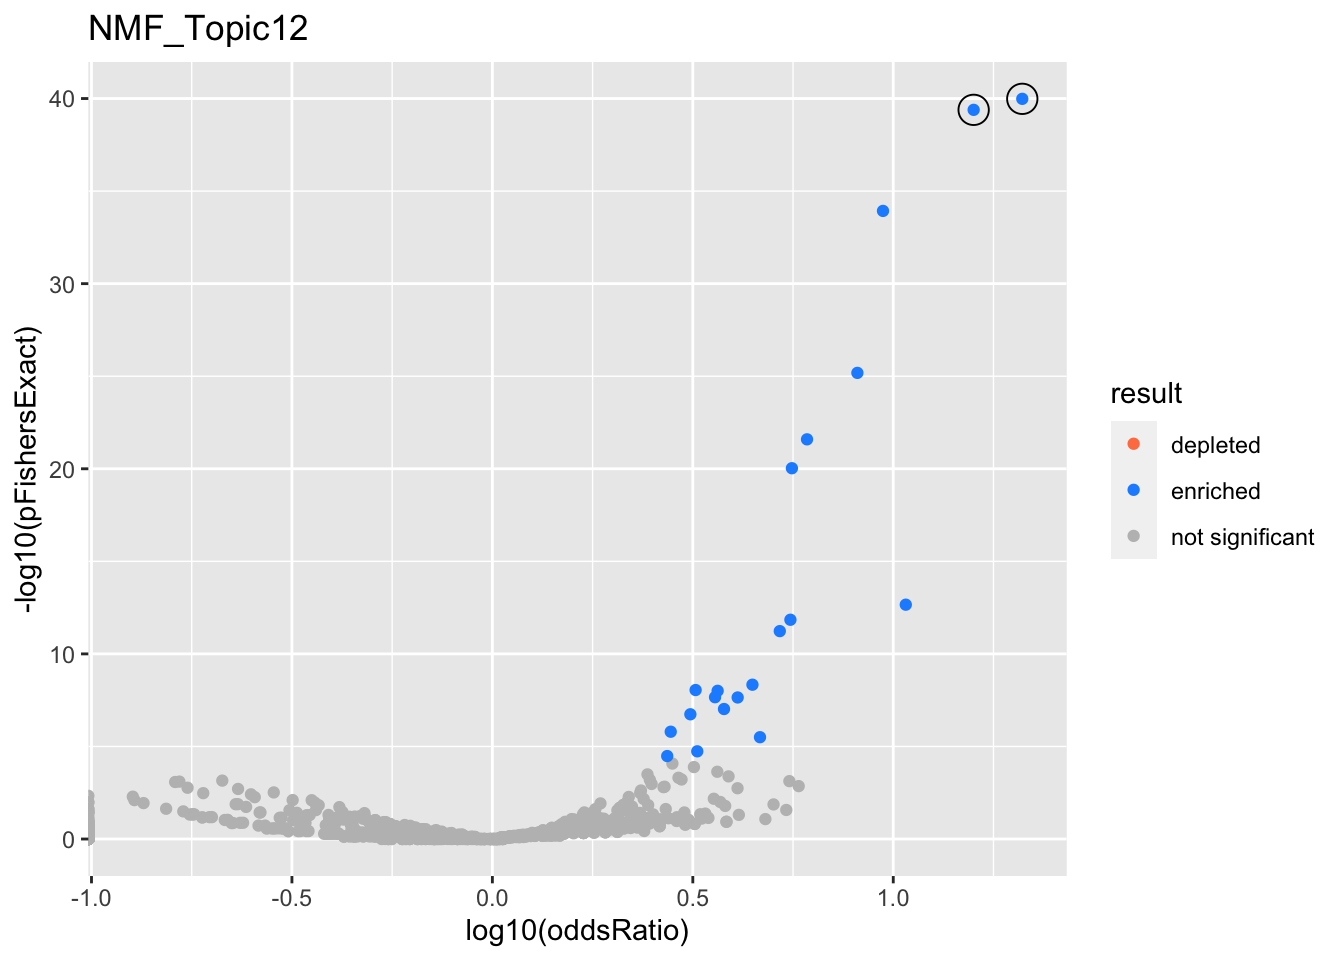
NMF_Topic12
Past versions of nmf.results-11.png
Version
Author
Date
a102c2d
karltayeb
2022-04-13
gobp_nr
geneSet
description
alpha
beta
beta.se
pHypergeometric
pFishersExact
overlap
geneSetSize
oddsRatio
L1
GO:0070972
protein localization to endoplasmic reticulum
1
1.87
0.181
1.04e-40
1.04e-40
51
131
21
L2
GO:0006413
translational initiation
1
1.72
0.159
4.08e-40
4.08e-40
57
177
15.9
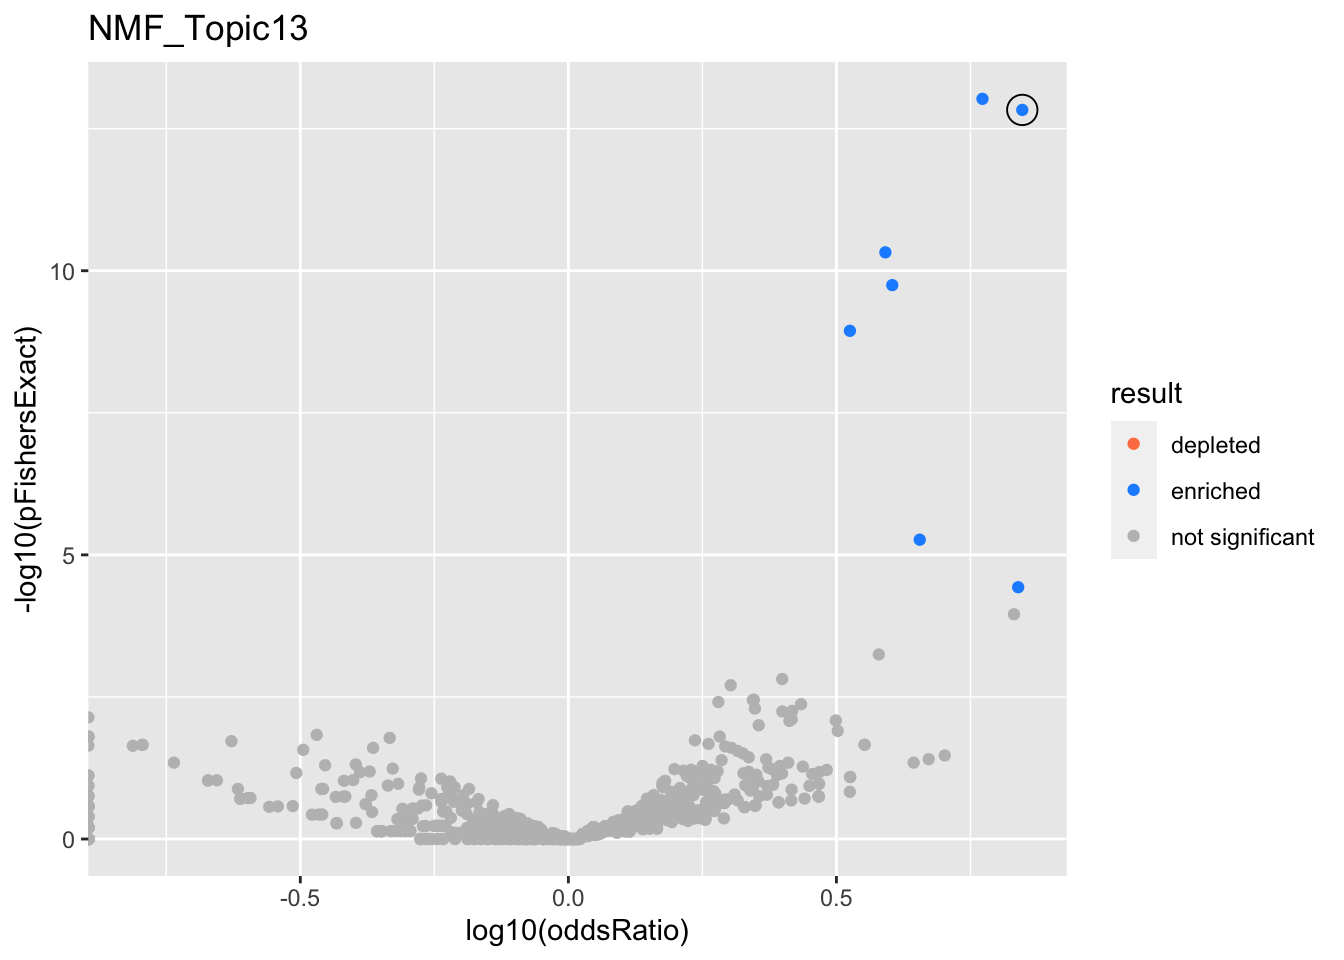
NMF_Topic13
Past versions of nmf.results-12.png
Version
Author
Date
a102c2d
karltayeb
2022-04-13
gobp_nr
geneSet
description
alpha
beta
beta.se
pHypergeometric
pFishersExact
overlap
geneSetSize
oddsRatio
L1
GO:0070972
protein localization to endoplasmic reticulum
1
1.88
0.185
1.48e-13
1.48e-13
29
131
7.03
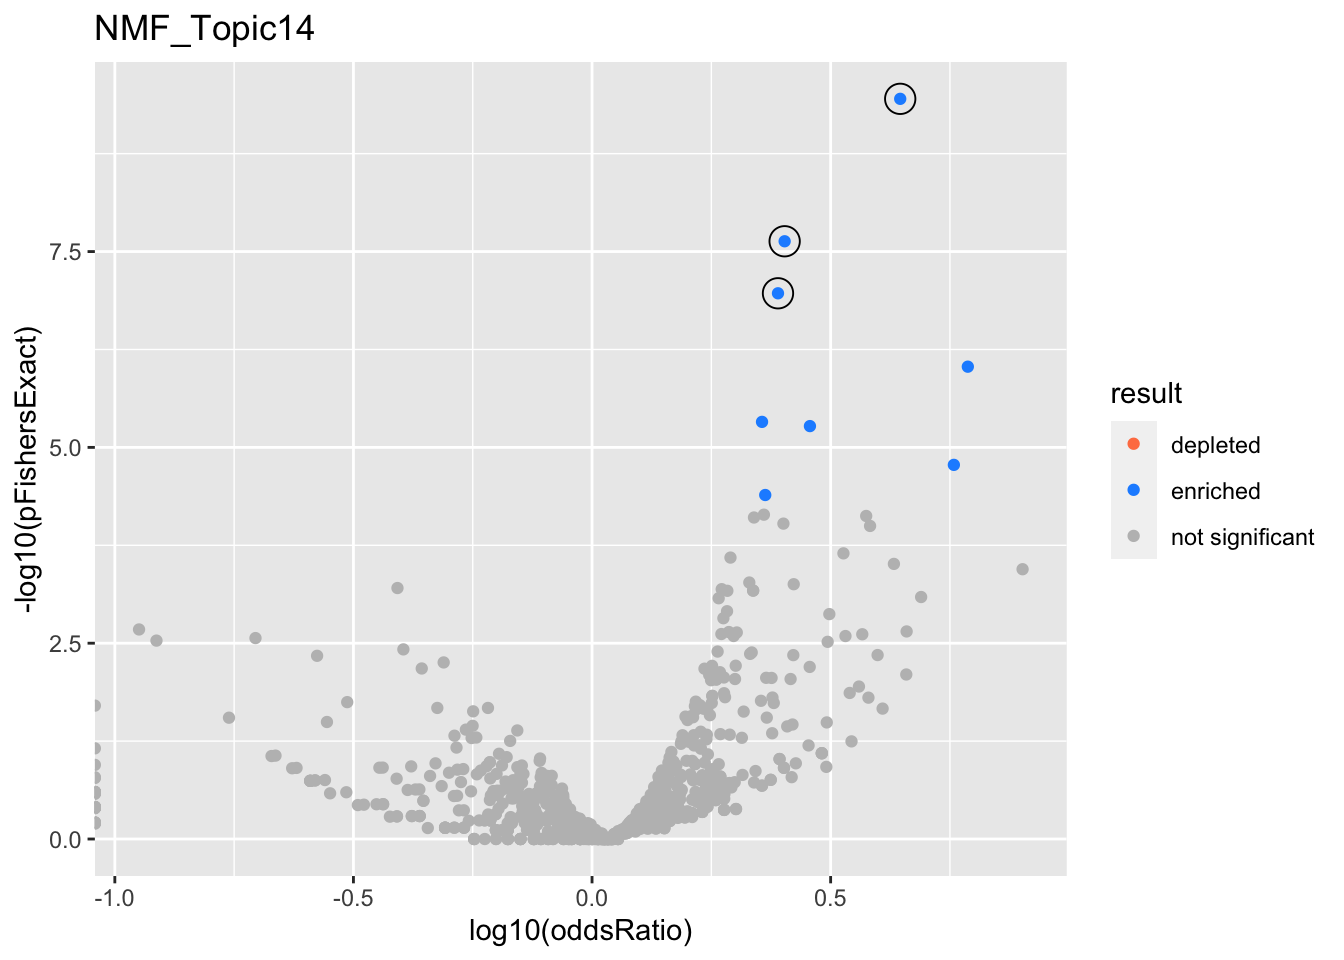
NMF_Topic14
Past versions of nmf.results-13.png
Version
Author
Date
a102c2d
karltayeb
2022-04-13
gobp_nr
geneSet
description
alpha
beta
beta.se
pHypergeometric
pFishersExact
overlap
geneSetSize
oddsRatio
L1
GO:0070972
protein localization to endoplasmic reticulum
1
1.38
0.181
3.55e-10
3.55e-10
36
131
4.42
L2
GO:0002446
neutrophil mediated immunity
0.849
0.818
0.111
1.84e-08
2.34e-08
68
386
2.53
GO:0036230
granulocyte activation
0.151
0.795
0.111
7.98e-08
1.08e-07
66
384
2.45
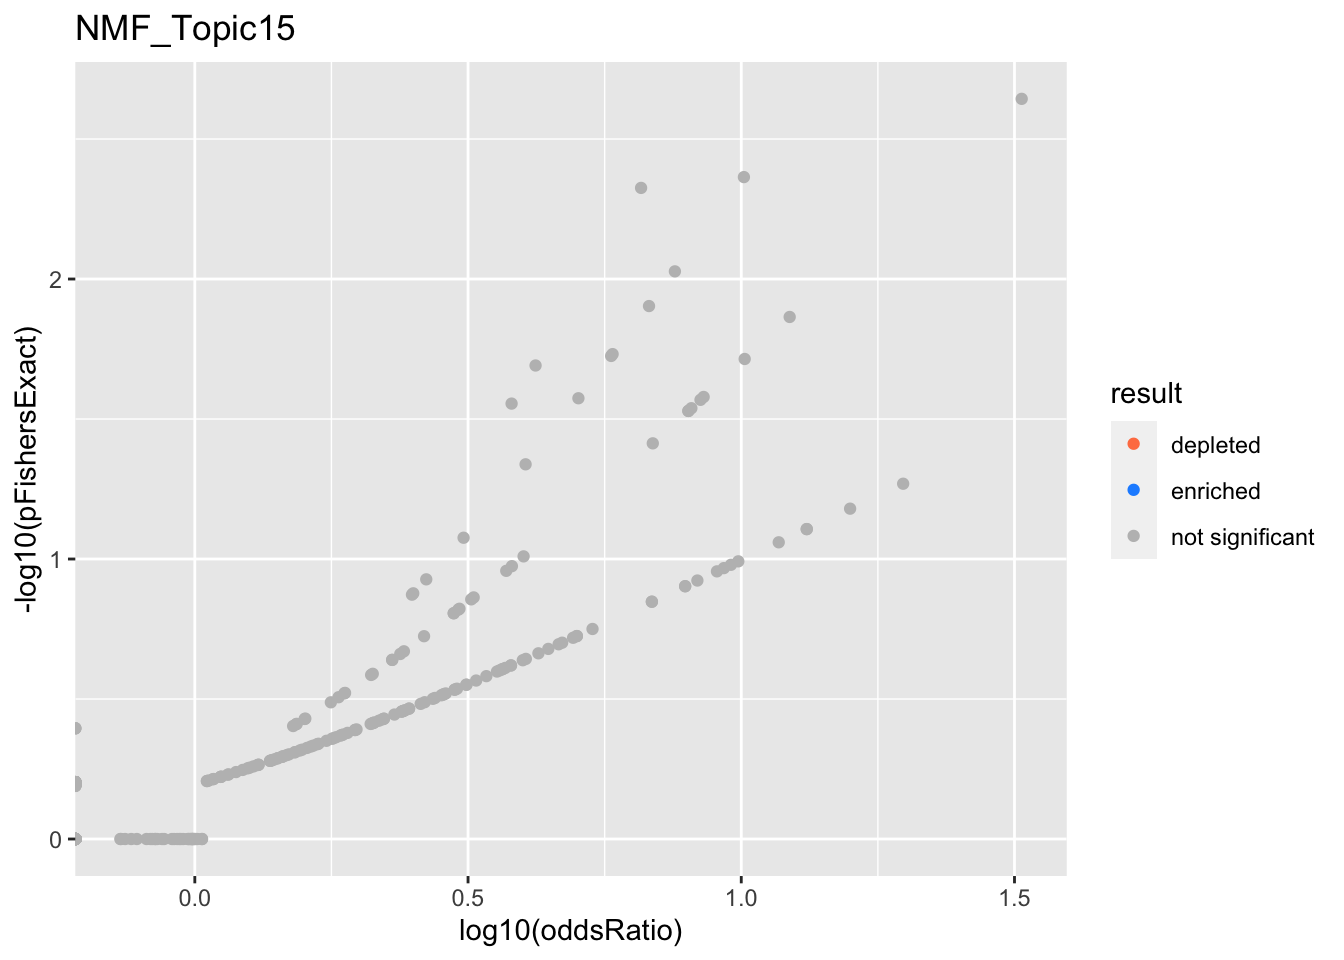
NMF_Topic15
Past versions of nmf.results-14.png
Version
Author
Date
a102c2d
karltayeb
2022-04-13
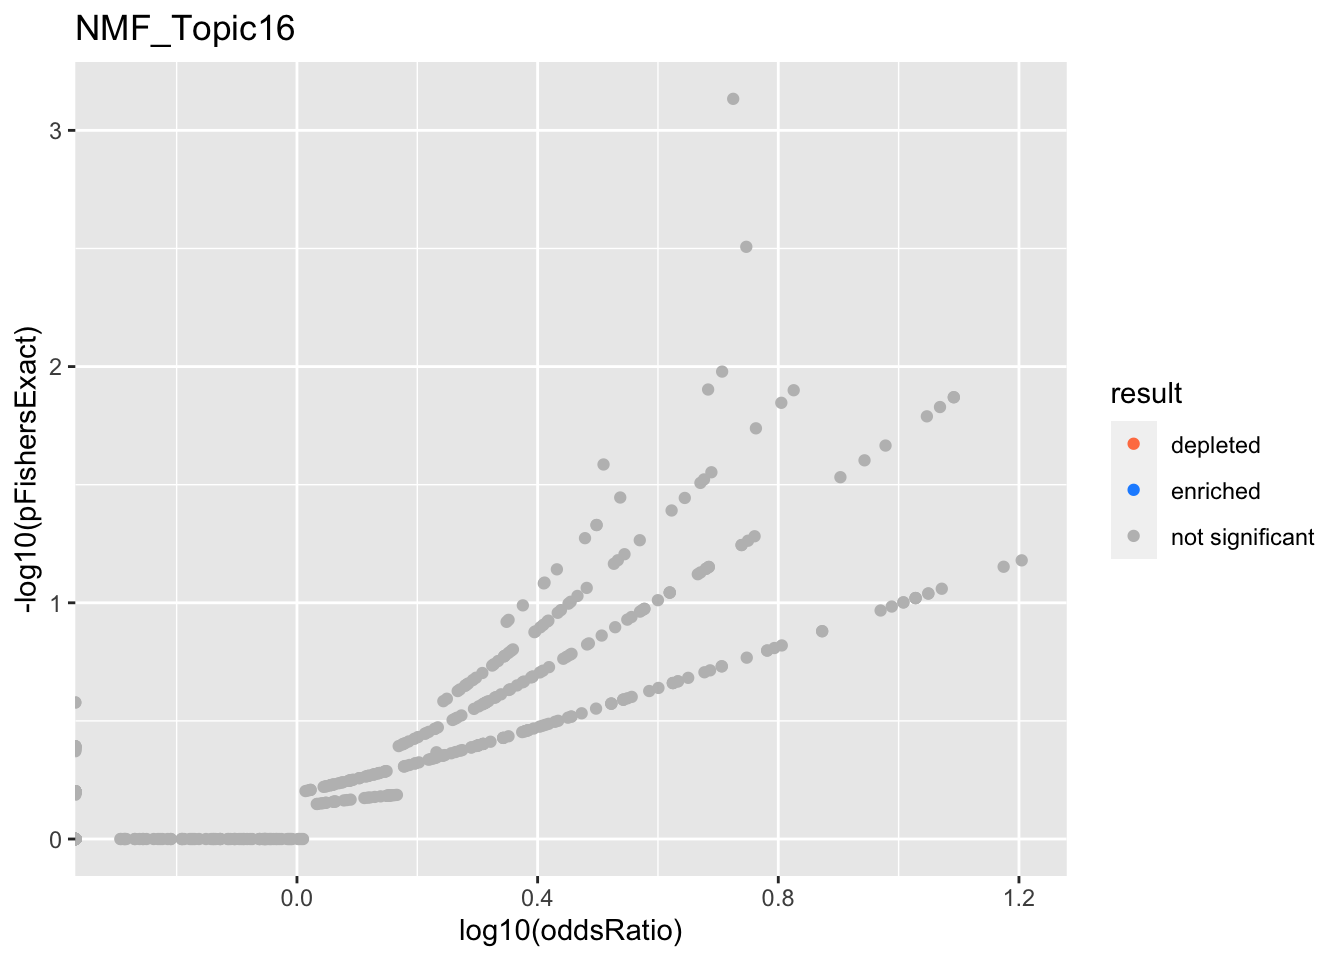
NMF_Topic16
Past versions of nmf.results-15.png
Version
Author
Date
a102c2d
karltayeb
2022-04-13
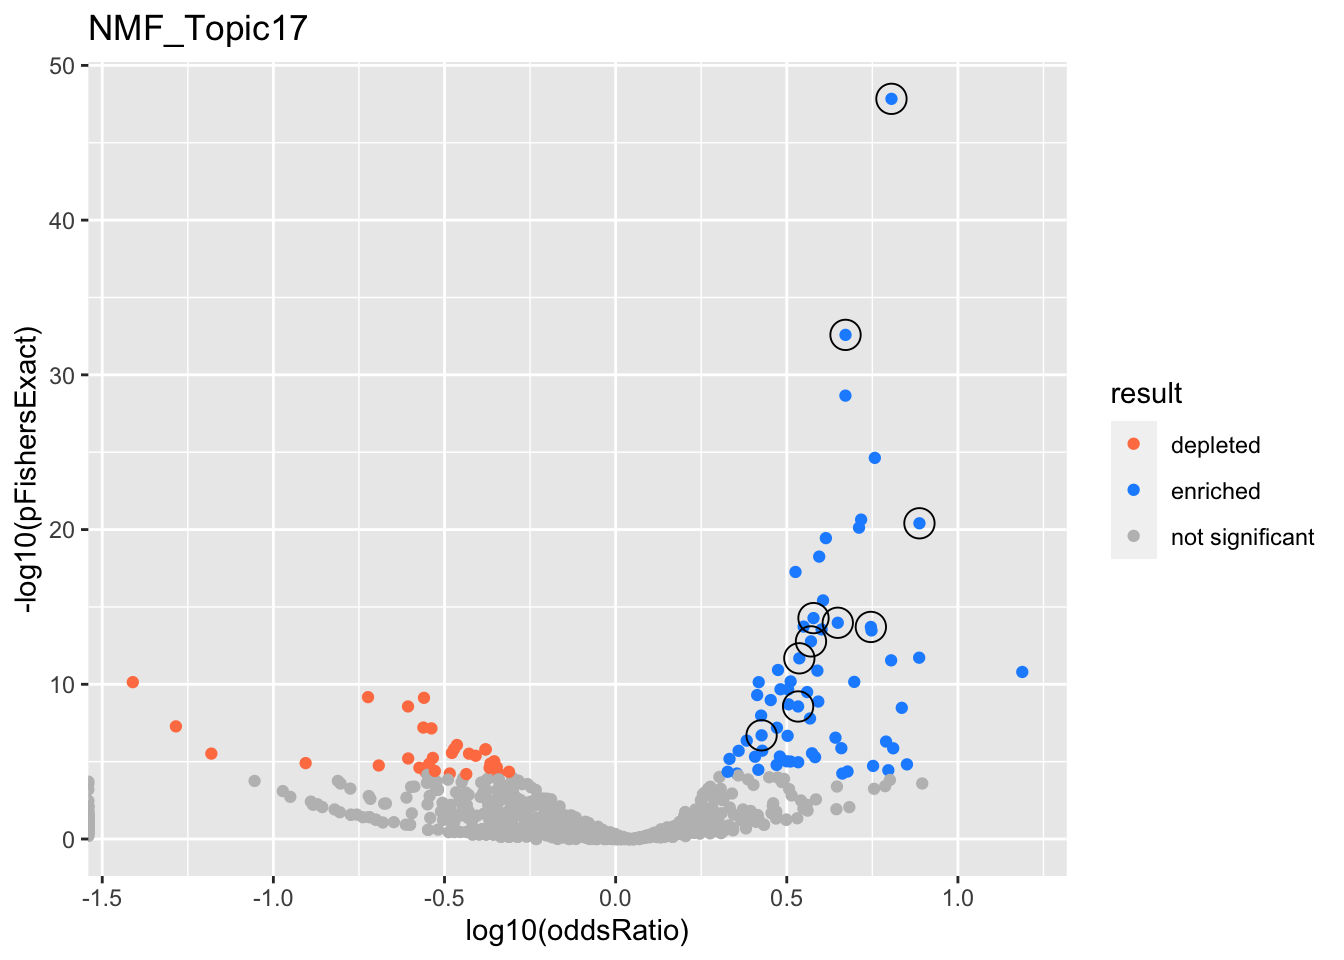
NMF_Topic17
Past versions of nmf.results-16.png
Version
Author
Date
a102c2d
karltayeb
2022-04-13
gobp_nr
geneSet
description
alpha
beta
beta.se
pHypergeometric
pFishersExact
overlap
geneSetSize
oddsRatio
L1
GO:0022613
ribonucleoprotein complex biogenesis
1
1.51
0.104
1.45e-48
1.45e-48
154
391
6.39
L10
GO:0009123
nucleoside monophosphate metabolic process
1
1.04
0.133
1.33e-07
1.99e-07
58
255
2.67
L2
GO:0006397
mRNA processing
0.999
0.994
0.101
2.61e-33
2.61e-33
139
425
4.7
L3
GO:0006414
translational elongation
1
1.76
0.185
1.96e-14
1.96e-14
46
121
5.57
L4
GO:0007059
chromosome segregation
1
1.11
0.131
5.27e-15
5.27e-15
74
254
3.79
L5
GO:0070646
protein modification by small protein removal
1
1.14
0.133
2.04e-12
2.1e-12
68
249
3.44
L6
GO:0006260
DNA replication
1
1.01
0.137
1.69e-13
1.69e-13
67
232
3.72
L7
GO:0006457
protein folding
1
1.26
0.156
2.37e-09
2.71e-09
49
179
3.41
L8
GO:0071166
ribonucleoprotein complex localization
0.999
1.23
0.188
3.93e-21
3.93e-21
54
118
7.72
L9
GO:0071824
protein-DNA complex subunit organization
1
1.13
0.155
1.05e-14
1.05e-14
59
180
4.46
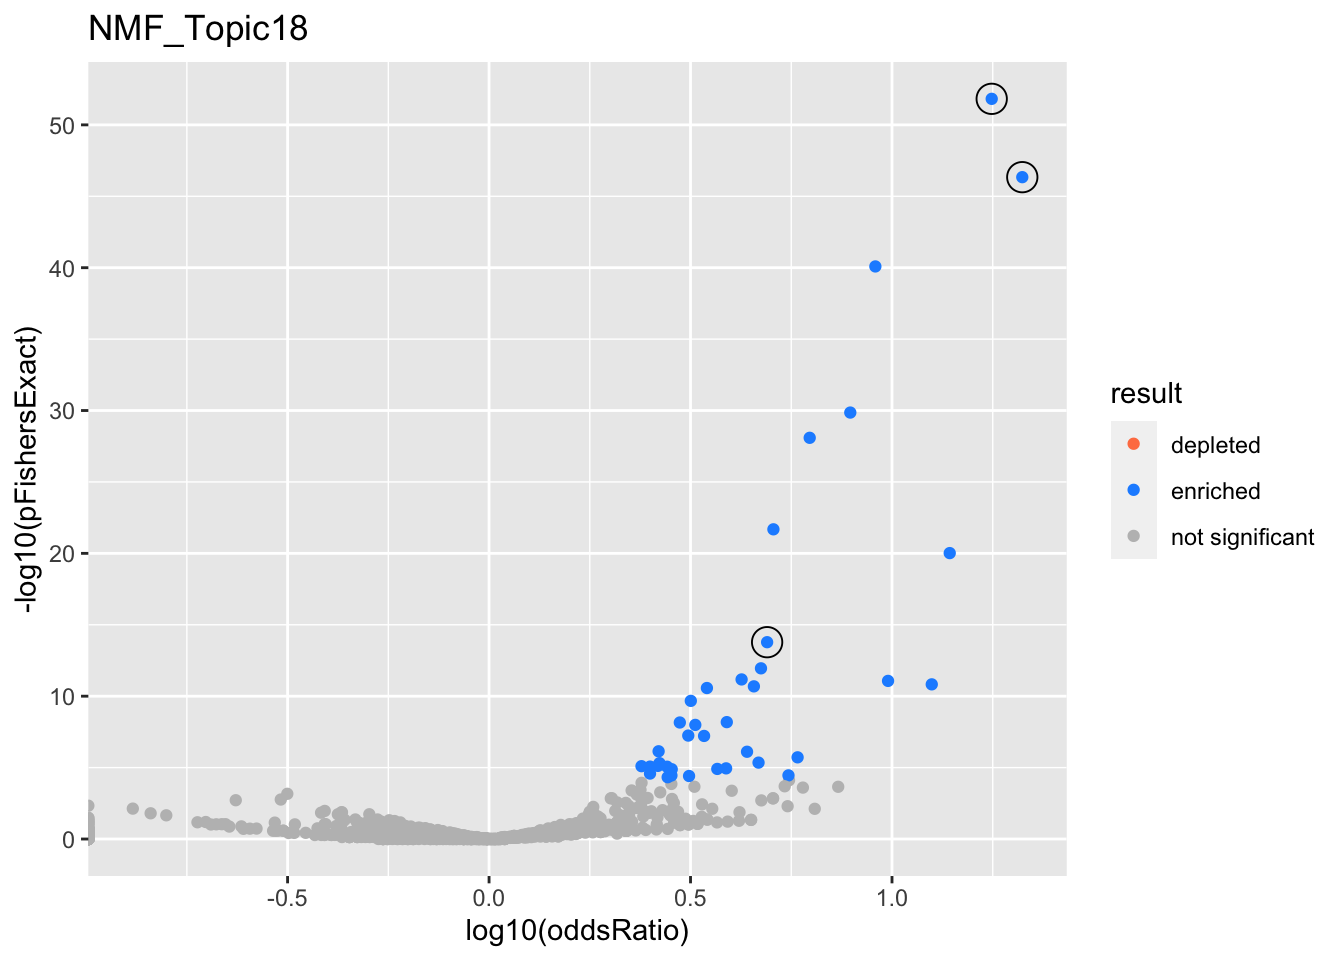
NMF_Topic18
Past versions of nmf.results-17.png
Version
Author
Date
a102c2d
karltayeb
2022-04-13
gobp_nr
geneSet
description
alpha
beta
beta.se
pHypergeometric
pFishersExact
overlap
geneSetSize
oddsRatio
L1
GO:0006413
translational initiation
1
2
0.156
1.5e-52
1.5e-52
75
177
17.7
L2
GO:0070972
protein localization to endoplasmic reticulum
1
1.79
0.181
4.58e-47
4.58e-47
62
131
21.1
L3
GO:0009141
nucleoside triphosphate metabolic process
1
1.66
0.14
1.66e-14
1.66e-14
44
244
4.9
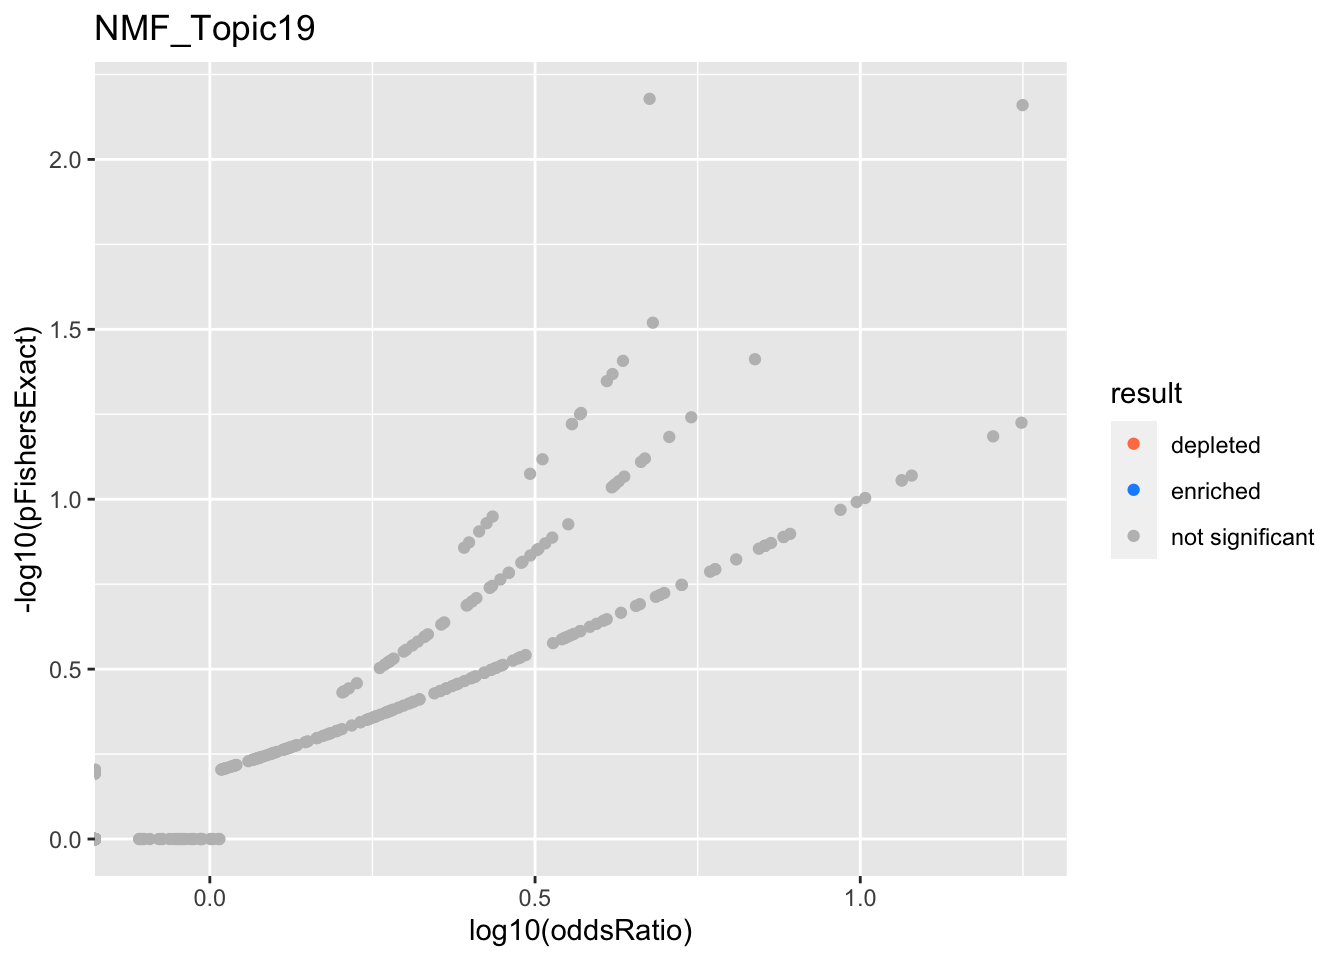
NMF_Topic19
Past versions of nmf.results-18.png
Version
Author
Date
a102c2d
karltayeb
2022-04-13
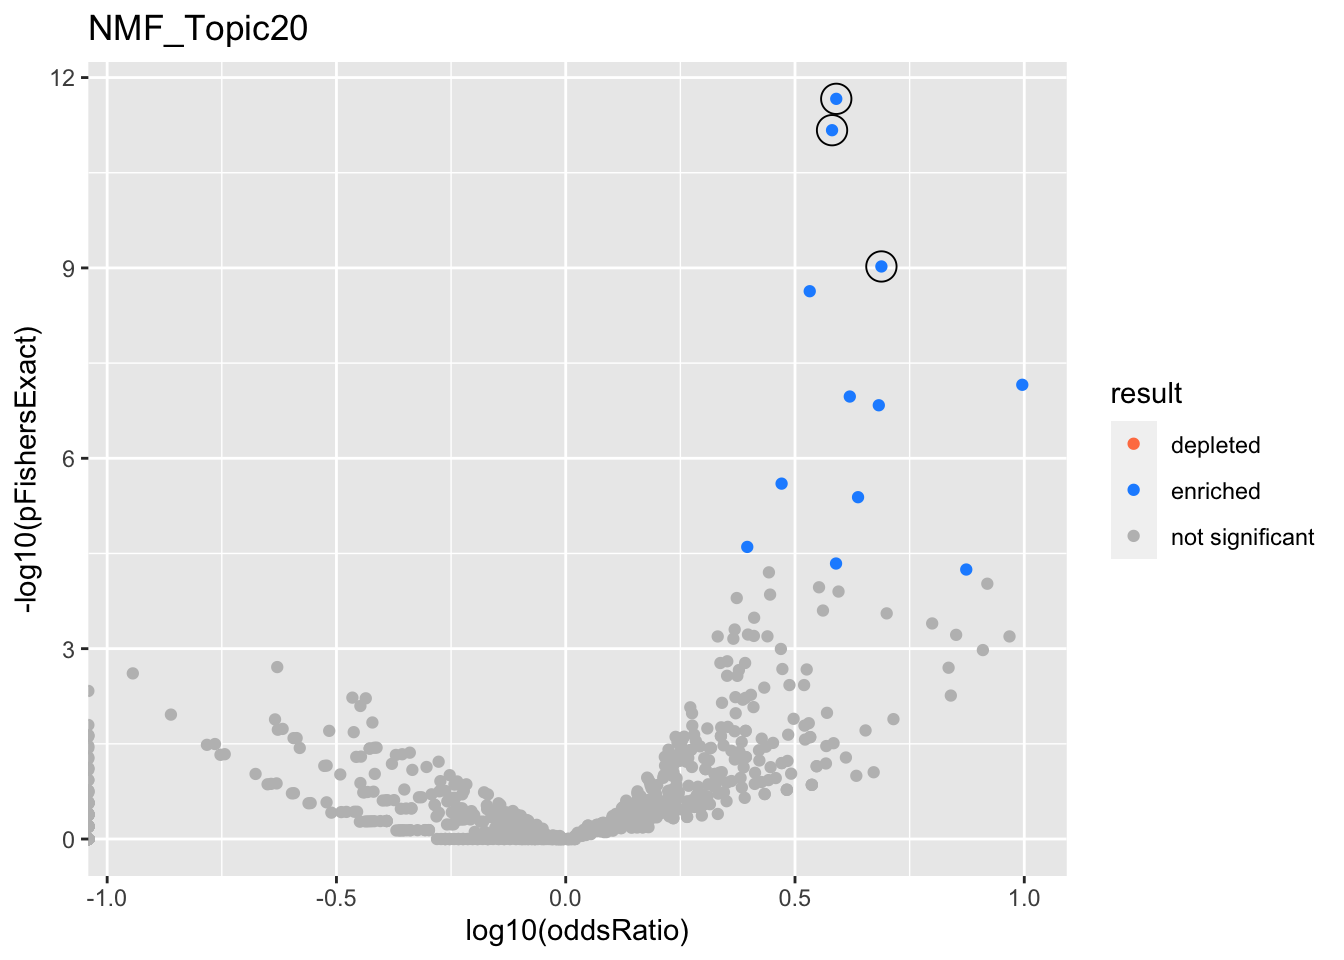
NMF_Topic20
Past versions of nmf.results-19.png
Version
Author
Date
a102c2d
karltayeb
2022-04-13
gobp_nr
geneSet
description
alpha
beta
beta.se
pHypergeometric
pFishersExact
overlap
geneSetSize
oddsRatio
L1
GO:0002446
neutrophil mediated immunity
0.91
1.33
0.116
2.16e-12
2.16e-12
47
386
3.89
GO:0036230
granulocyte activation
0.0903
1.31
0.117
6.76e-12
6.76e-12
46
384
3.81
L2
GO:0006413
translational initiation
1
1.58
0.167
9.48e-10
9.48e-10
27
177
4.88
SNMF
res <- fits %>%
  filter(str_detect(experiment, '^SNMF*')) %>%
  get_plot_tbl(., ora)

html_tables <- fits %>%
  filter(str_detect(experiment, '^SNMF*')) %>%
  get_table_tbl(., ora)

experiments <- unique(res$experiment)
for (i in 1:length(experiments)){
  this_experiment <- experiments[i]
  cat("\n")
  cat("###", this_experiment, "\n") # Create second level headings with the names.

  # print volcano plot
  p <- do.volcano(res %>% filter(experiment == this_experiment)) +
    labs(title=this_experiment)
  print(p)

  cat("\n\n")

  # print table
  for(db in names(html_tables[[this_experiment]])){
    cat("####", db, "\n") # Create second level headings with the names.
    to_print <- html_tables[[this_experiment]][[db]] %>% distinct()
    to_print %>% report_susie_credible_sets() %>% htmltools::HTML() %>% print()
    cat("\n")
  }}
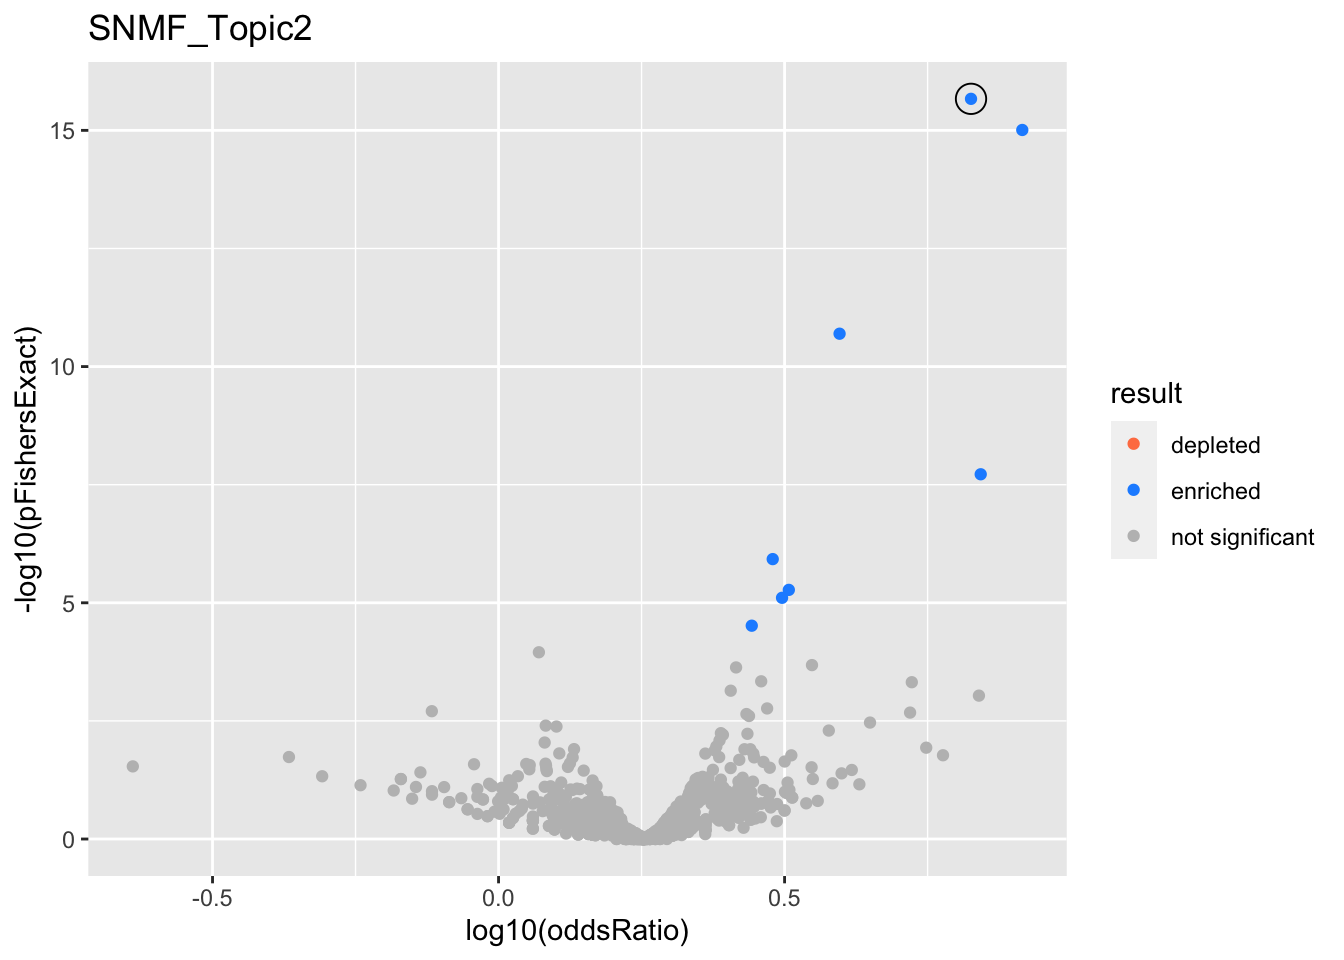
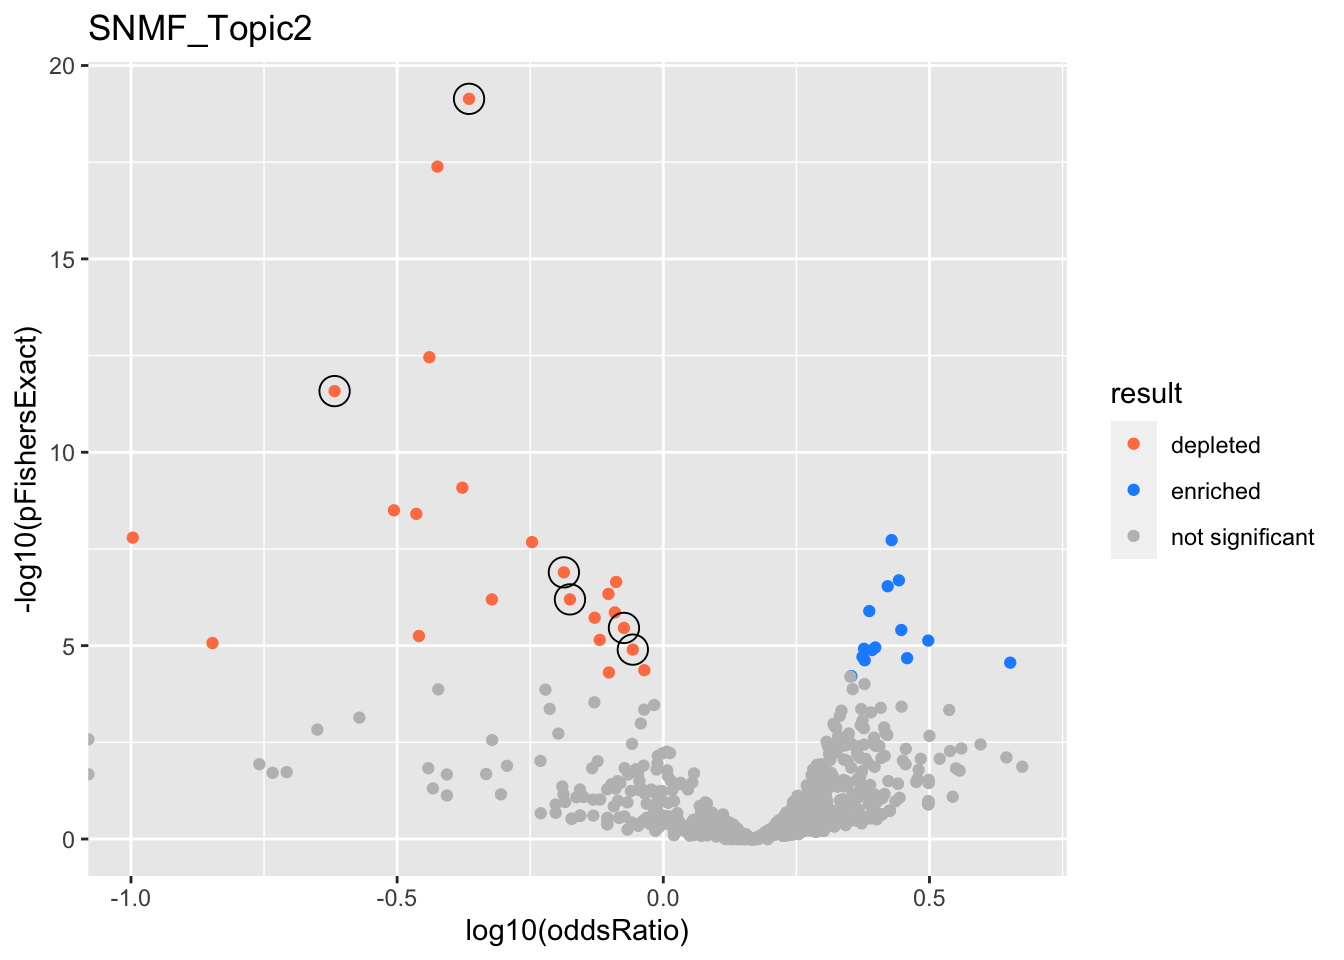
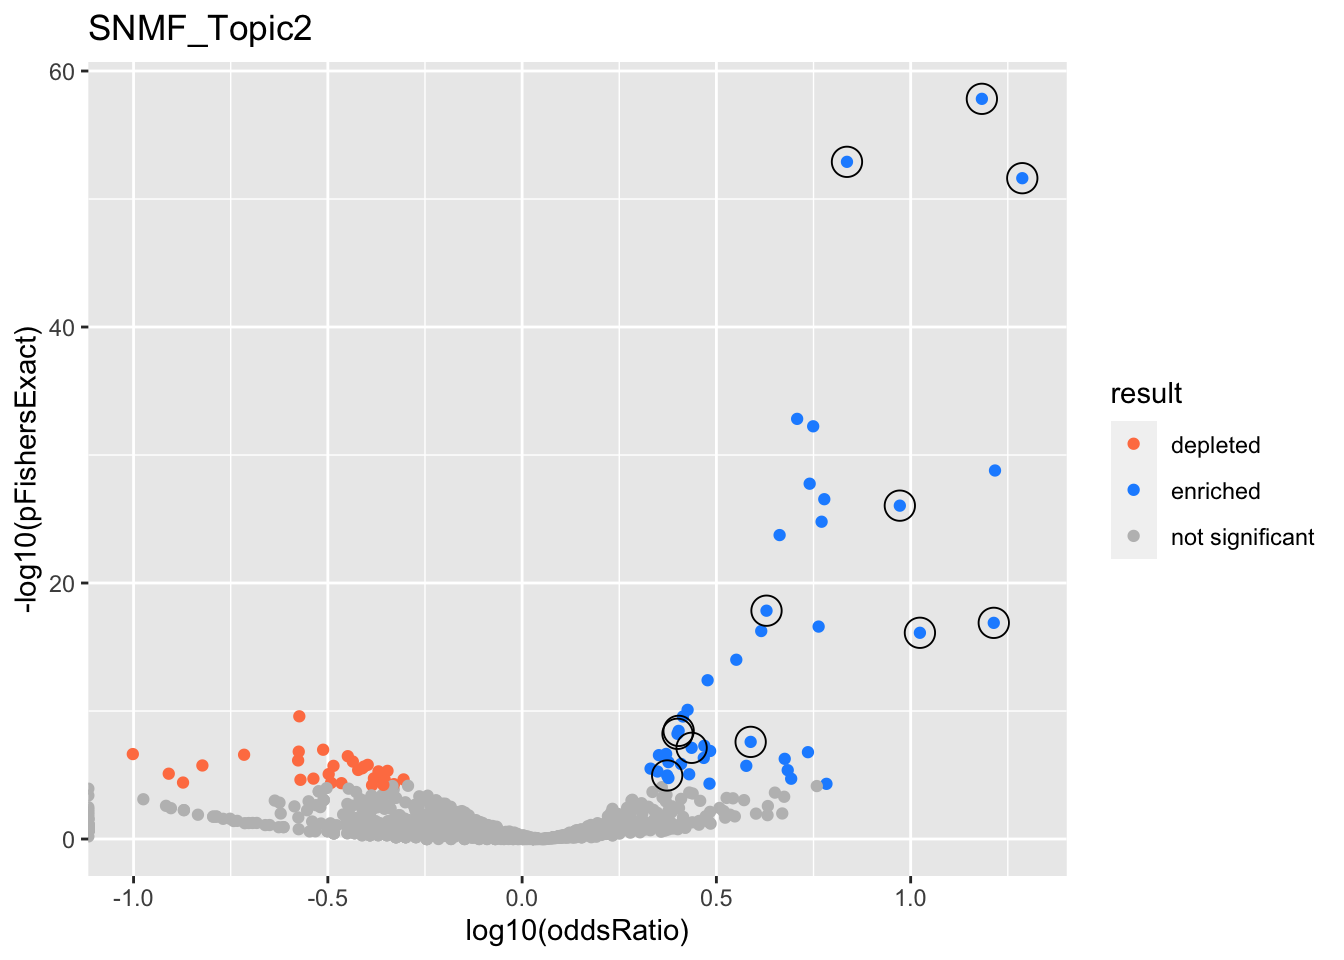
SNMF_Topic2
Past versions of snmf.results-1.png
Version
Author
Date
a102c2d
karltayeb
2022-04-13
gobp_nr
geneSet
description
alpha
beta
beta.se
pHypergeometric
pFishersExact
overlap
geneSetSize
oddsRatio
L1
GO:0006413
translational initiation
0.993
1.21
0.156
1.14e-16
2.15e-16
131
177
6.7
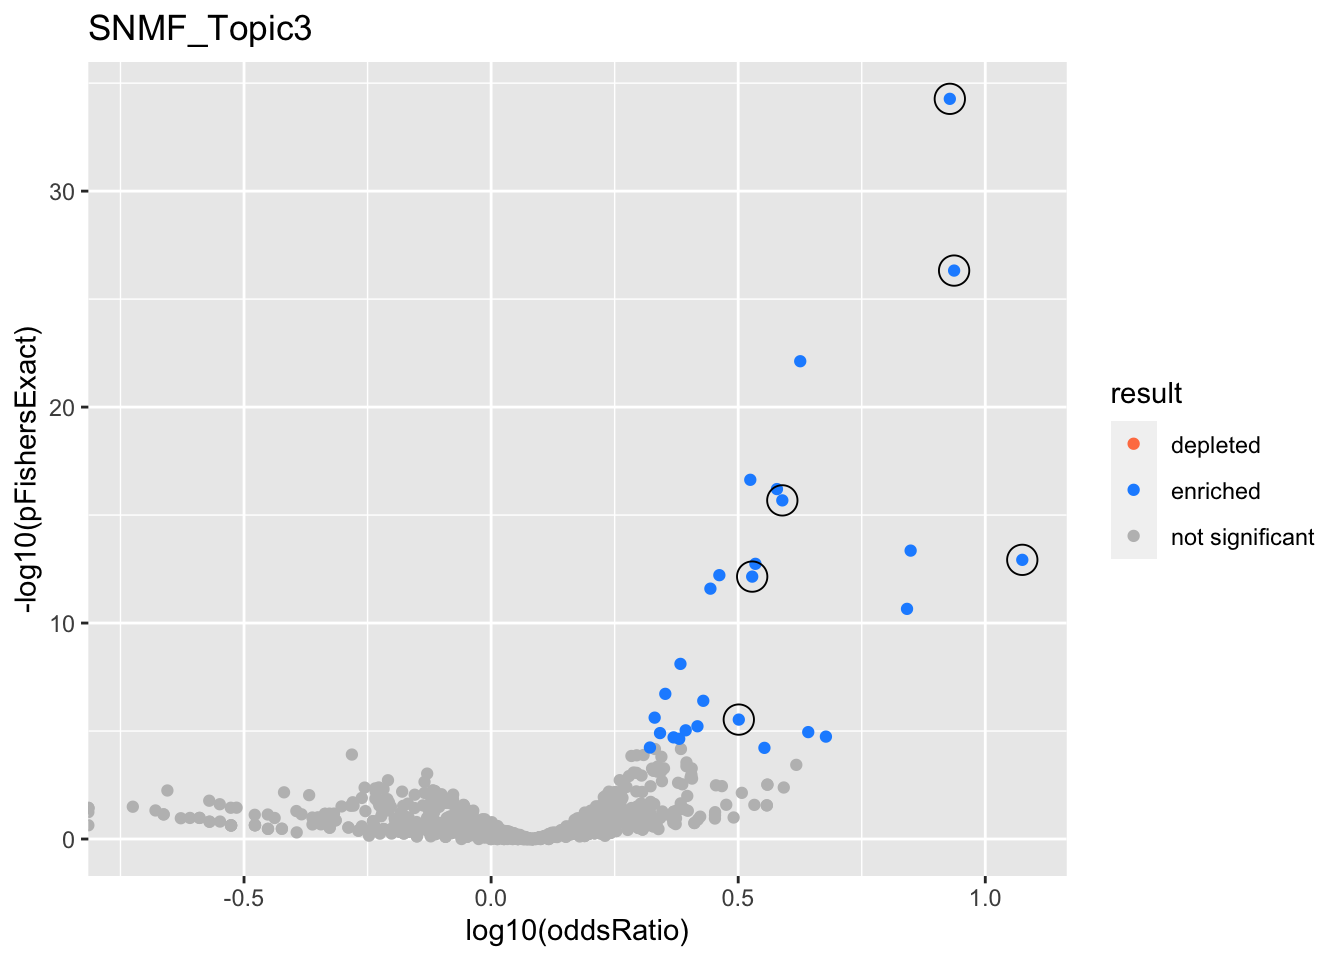
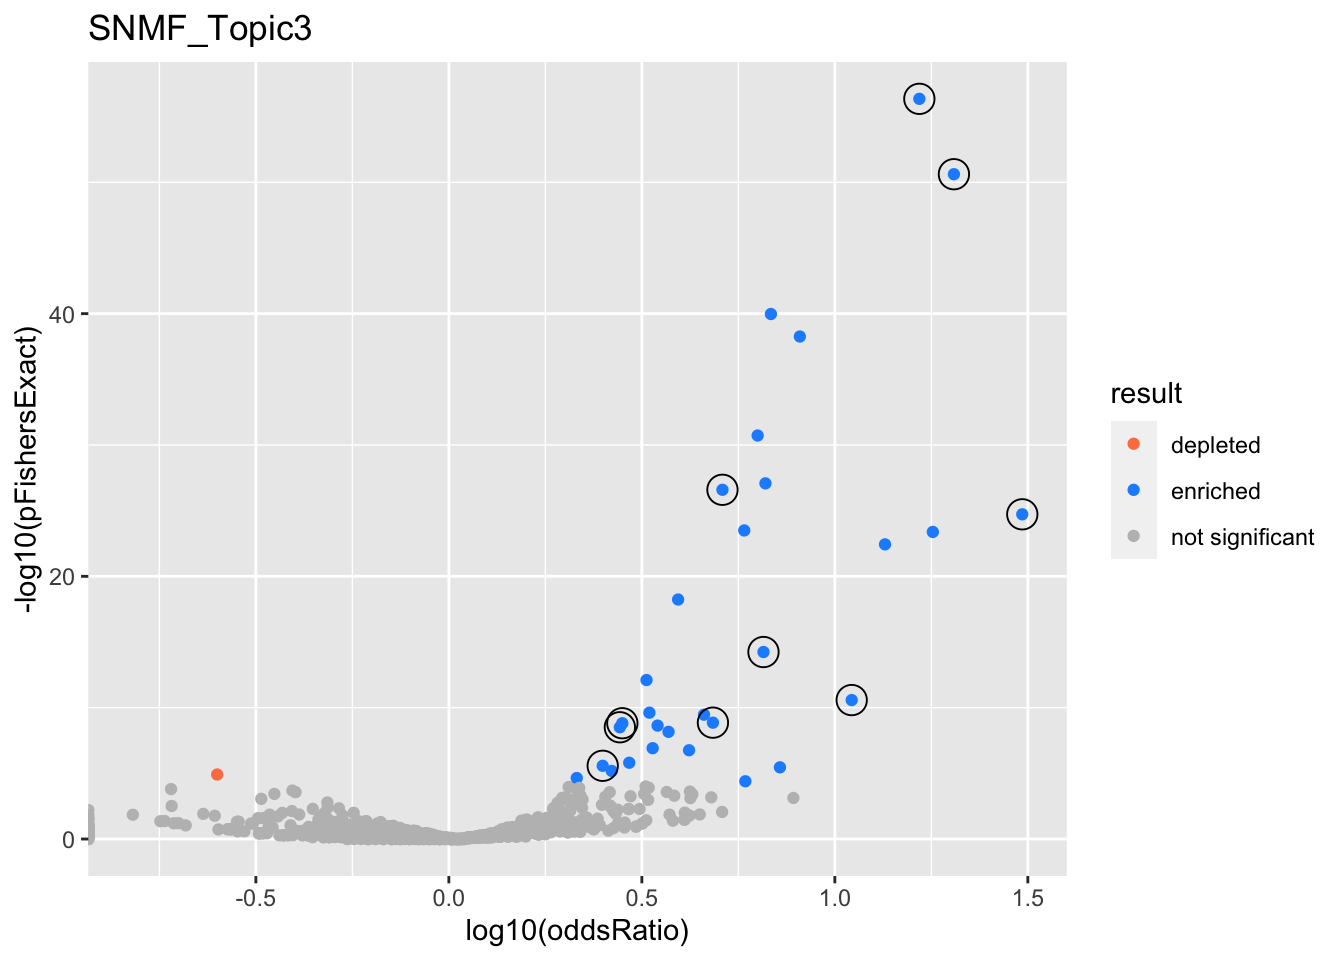
SNMF_Topic3
Past versions of snmf.results-2.png
Version
Author
Date
a102c2d
karltayeb
2022-04-13
gobp_nr
geneSet
description
alpha
beta
beta.se
pHypergeometric
pFishersExact
overlap
geneSetSize
oddsRatio
L1
GO:0006413
translational initiation
1
1.49
0.153
5.33e-35
5.33e-35
104
177
8.48
L2
GO:0009141
nucleoside triphosphate metabolic process
0.998
0.975
0.13
1.71e-16
2.09e-16
97
244
3.88
L3
GO:0070646
protein modification by small protein removal
1
1.04
0.128
5.44e-13
7.07e-13
91
249
3.38
L4
GO:0070972
protein localization to endoplasmic reticulum
0.992
1.12
0.178
4.78e-27
4.78e-27
78
131
8.65
L5
GO:0010257
NADH dehydrogenase complex assembly
0.976
1.67
0.299
1.18e-13
1.18e-13
31
46
11.9
GO:0033108
mitochondrial respiratory chain complex assembly
0.0234
1.27
0.258
2.2e-11
2.2e-11
35
64
6.94
L6
GO:0006414
translational elongation
0.991
0.962
0.183
1.77e-06
2.95e-06
43
121
3.17
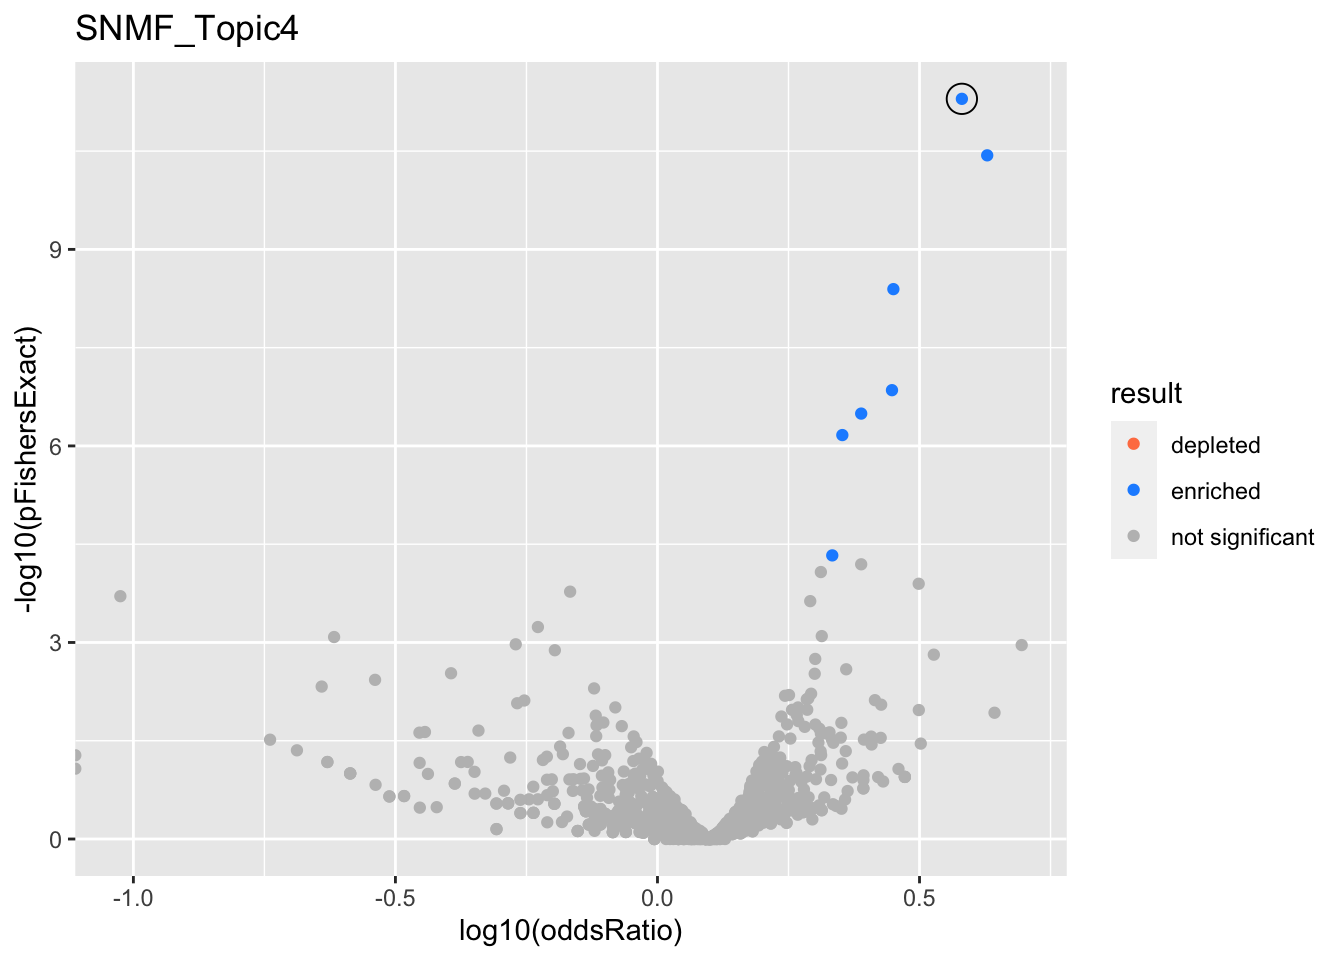
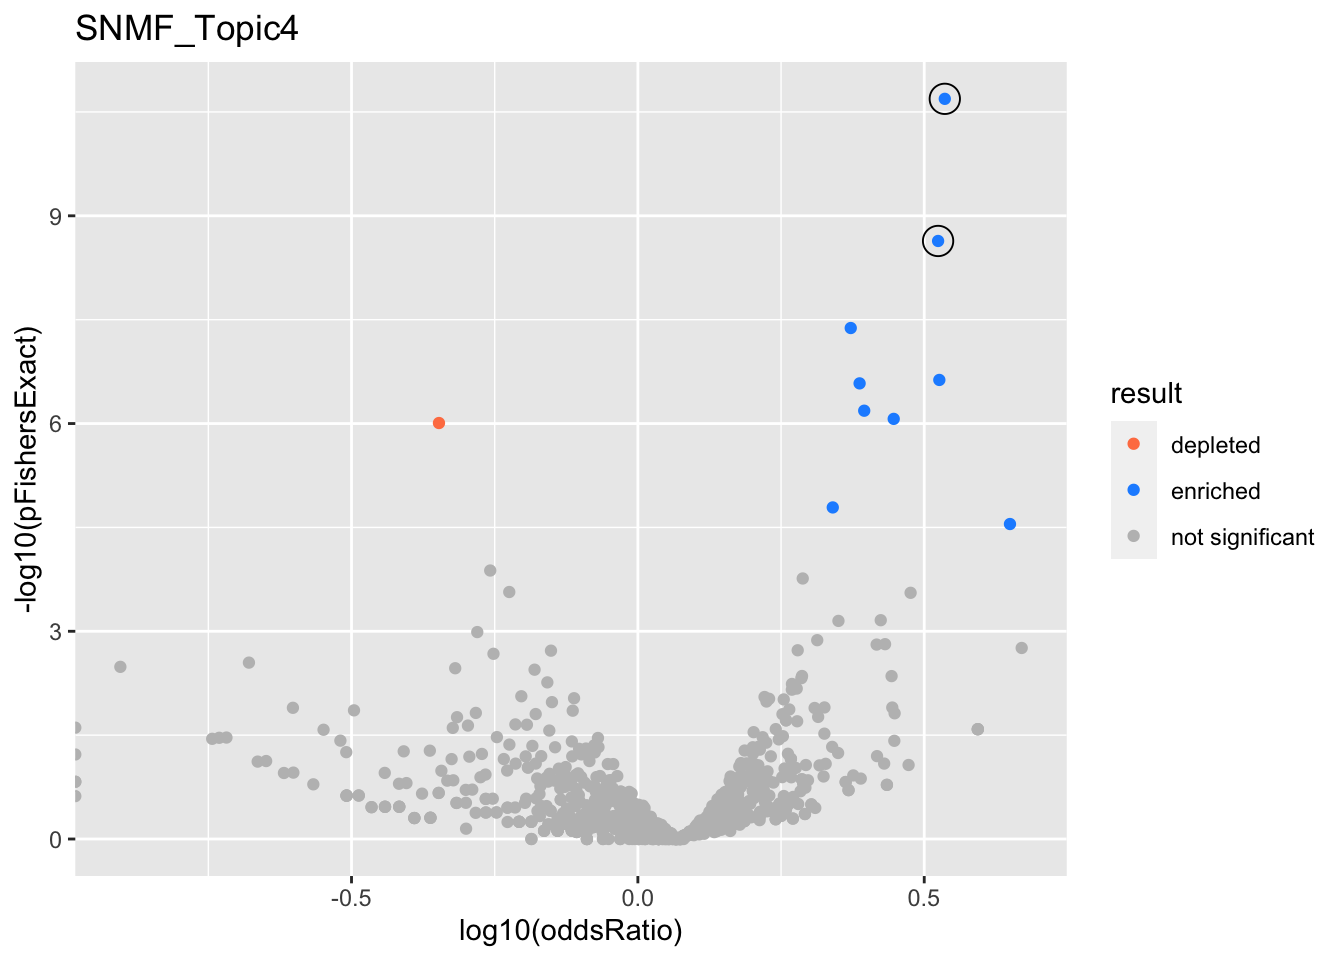
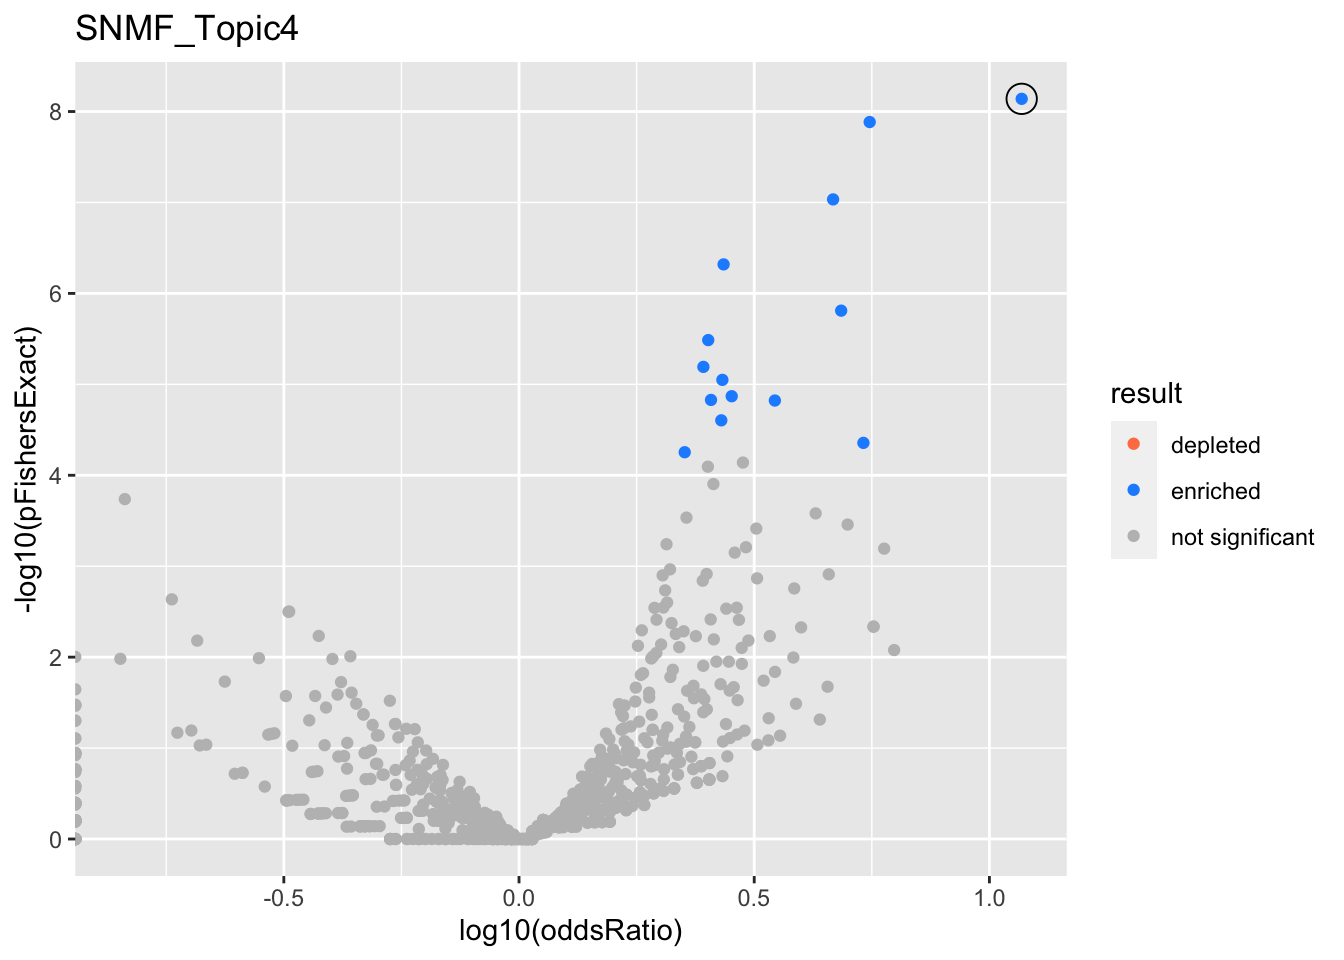
SNMF_Topic4
Past versions of snmf.results-3.png
Version
Author
Date
a102c2d
karltayeb
2022-04-13
gobp_nr
geneSet
description
alpha
beta
beta.se
pHypergeometric
pFishersExact
overlap
geneSetSize
oddsRatio
L1
GO:0006413
translational initiation
0.988
1.04
0.15
4.52e-12
5.04e-12
76
177
3.81
GO:0070972
protein localization to endoplasmic reticulum
0.0122
1.11
0.177
3.3e-11
3.67e-11
60
131
4.26
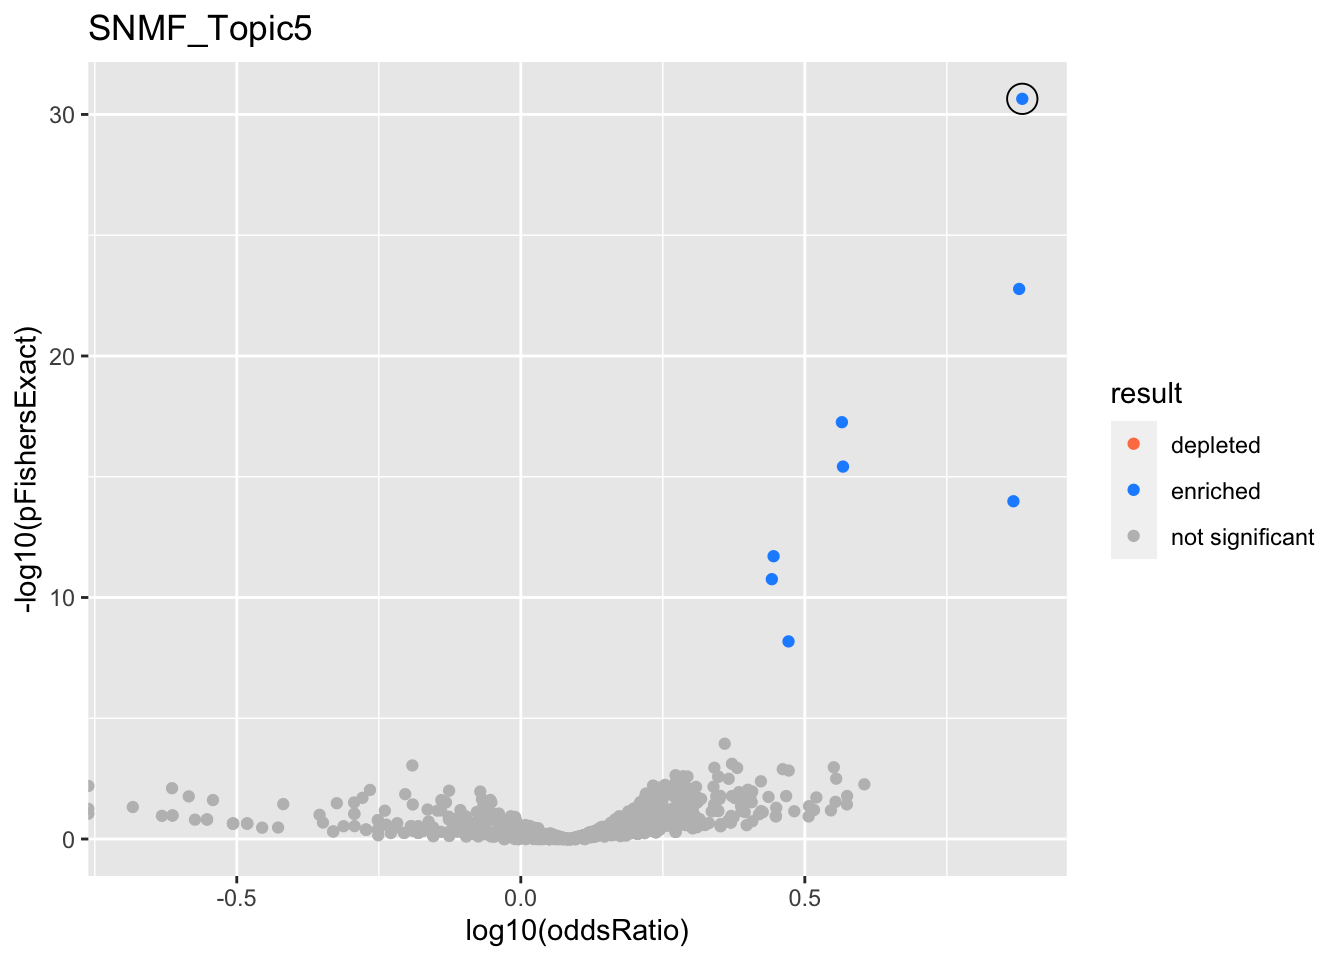
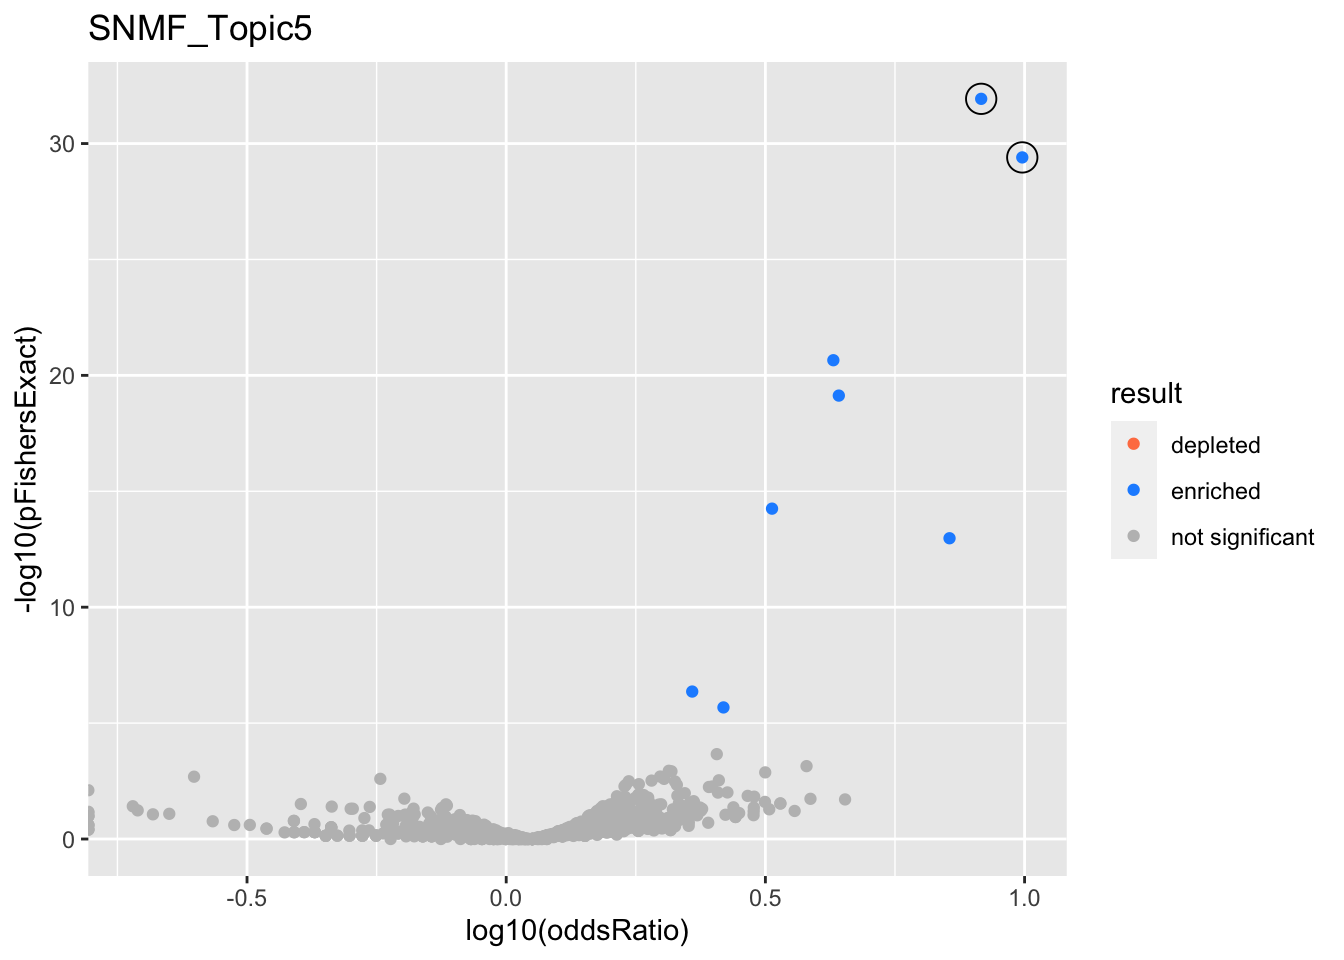
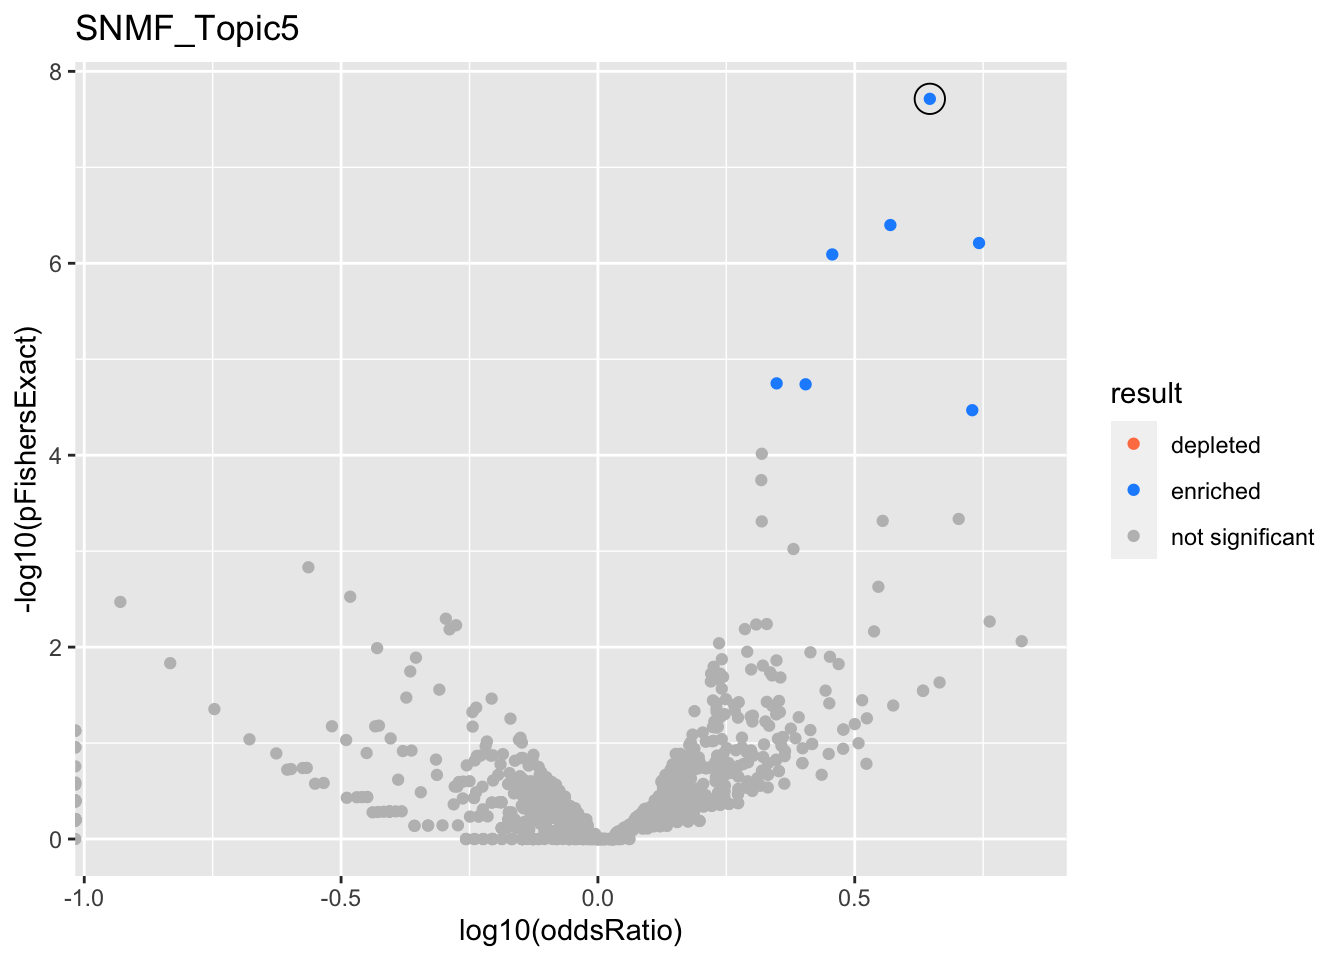
SNMF_Topic5
Past versions of snmf.results-4.png
Version
Author
Date
a102c2d
karltayeb
2022-04-13
gobp_nr
geneSet
description
alpha
beta
beta.se
pHypergeometric
pFishersExact
overlap
geneSetSize
oddsRatio
L1
GO:0006413
translational initiation
1
1.71
0.151
2.26e-31
2.26e-31
100
177
7.64
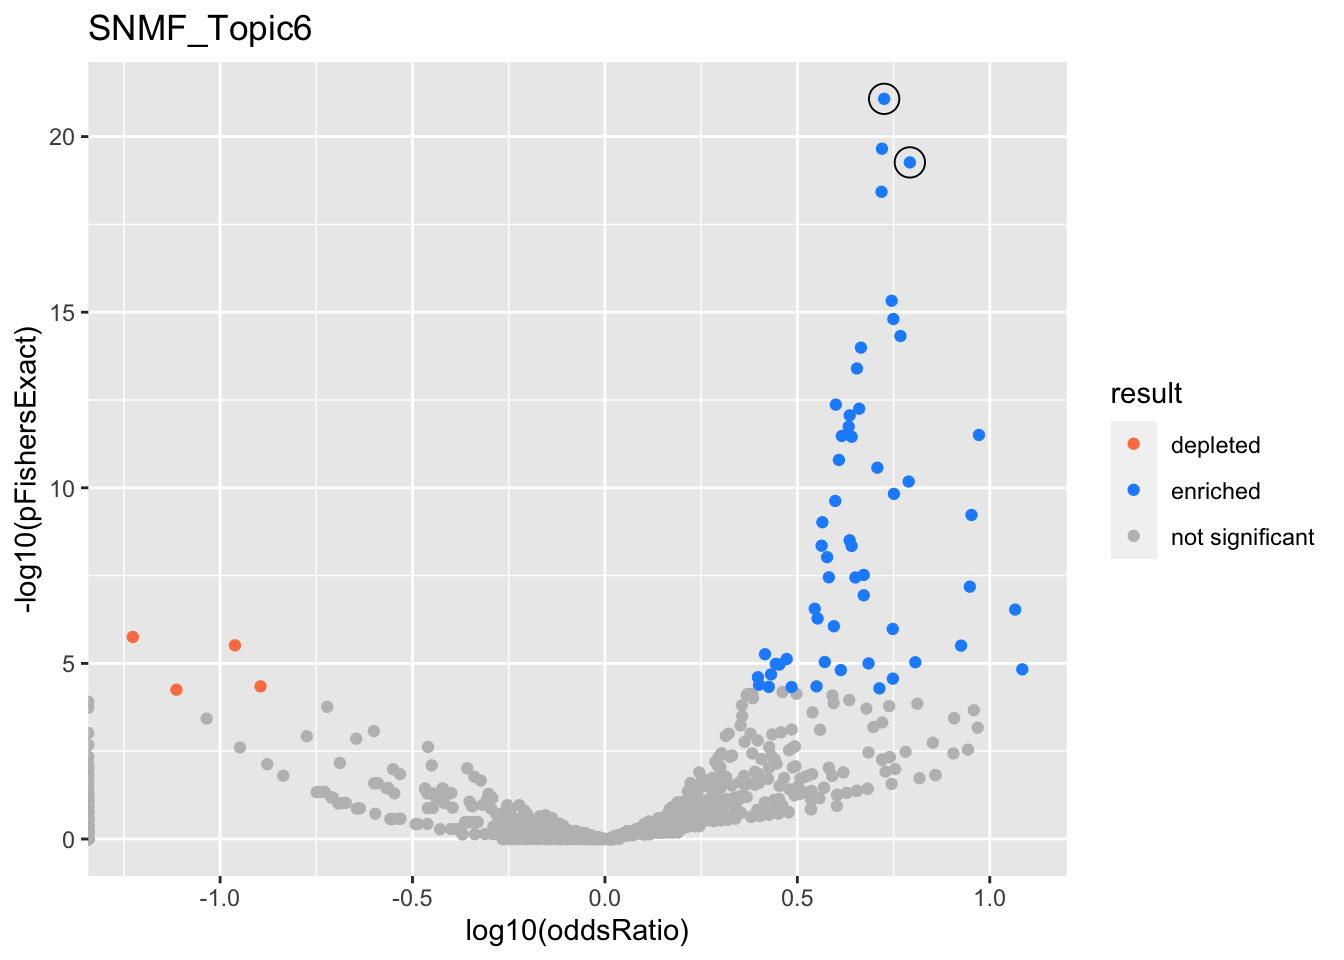
SNMF_Topic6
Past versions of snmf.results-5.png
Version
Author
Date
a102c2d
karltayeb
2022-04-13
gobp_nr
geneSet
description
alpha
beta
beta.se
pHypergeometric
pFishersExact
overlap
geneSetSize
oddsRatio
L1
GO:0002521
leukocyte differentiation
1
1.19
0.113
9.51e-22
9.51e-22
64
390
5.3
L2
GO:0002250
adaptive immune response
1
1.19
0.135
5.99e-20
5.99e-20
50
263
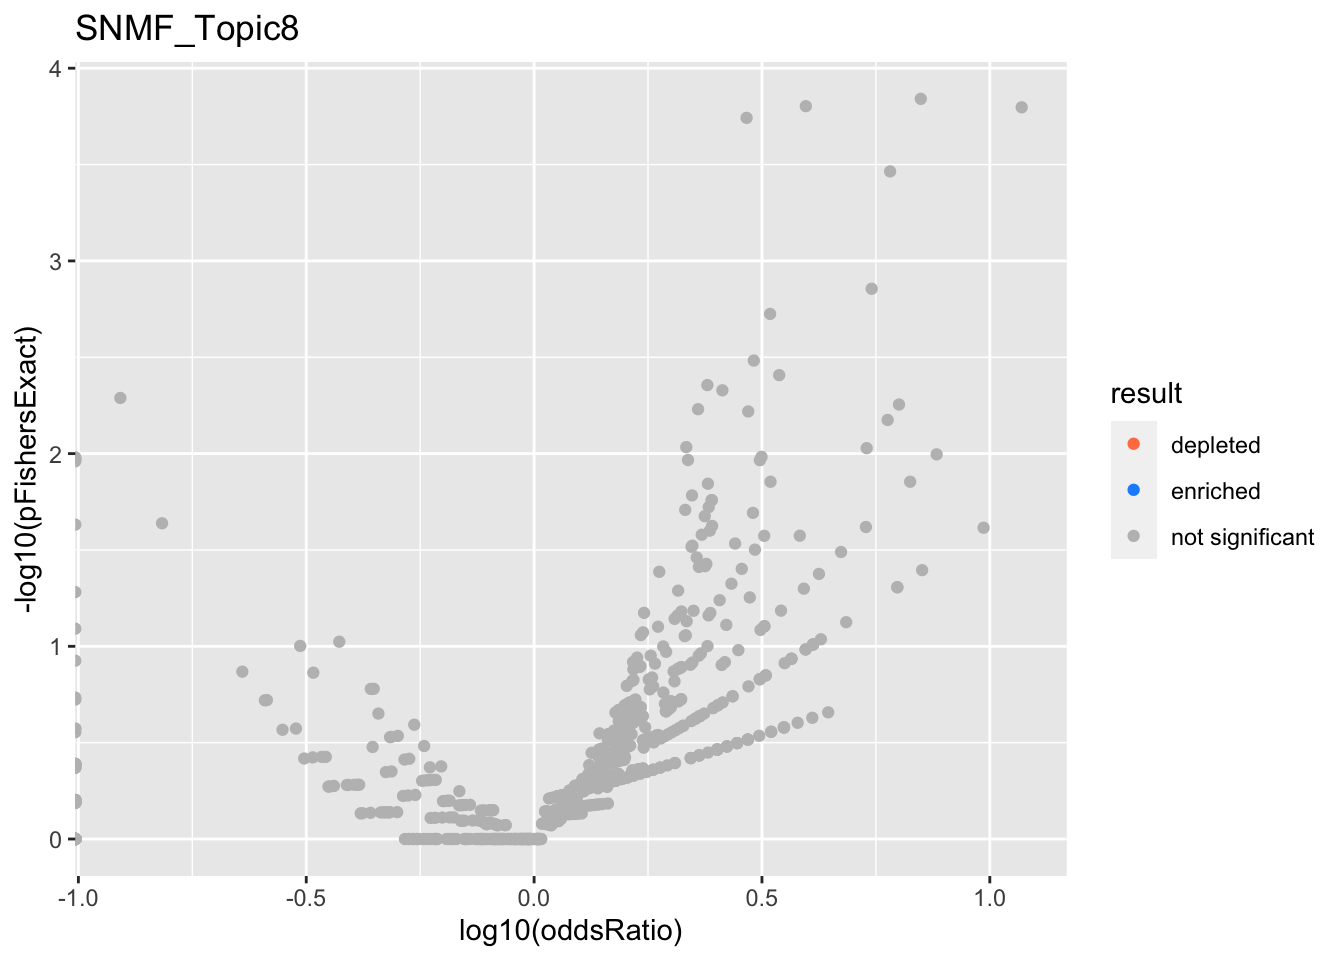
6.18
SNMF_Topic7
Past versions of snmf.results-6.png
Version
Author
Date
a102c2d
karltayeb
2022-04-13
gobp_nr
geneSet
description
alpha
beta
beta.se
pHypergeometric
pFishersExact
overlap
geneSetSize
oddsRatio
L1
GO:0022613
ribonucleoprotein complex biogenesis
1
1.41
0.104
1.63e-71
1.63e-71
236
391
8.45
L10
GO:0098781
ncRNA transcription
0.929
1.25
0.221
4.02e-15
4.02e-15
51
88
7.05
GO:0016073
snRNA metabolic process
0.0509
1.17
0.23
3.94e-13
3.94e-13
45
79
6.75
GO:0006383
transcription by RNA polymerase III
0.0102
1.43
0.304
1.59e-08
1.59e-08
27
47
6.84
L2
GO:0006413
translational initiation
1
1.67
0.156
2.13e-39
2.13e-39
115
177
9.77
L3
GO:0006397
mRNA processing
1
0.965
0.0992
1.03e-42
1.03e-42
208
425
5.21
L4
GO:0070646
protein modification by small protein removal
1
0.983
0.128
5.73e-12
9.41e-12
96
249
3.25
L5
GO:0006360
transcription by RNA polymerase I
0.998
1.72
0.292
4.62e-17
4.62e-17
39
53
14.2
L6
GO:0007059
chromosome segregation
1
0.938
0.128
8.49e-12
9.99e-12
97
254
3.2
L7
GO:0009123
nucleoside monophosphate metabolic process
0.731
0.813
0.128
2.19e-06
3.4e-06
82
255
2.43
GO:0009141
nucleoside triphosphate metabolic process
0.261
0.811
0.131
1.24e-06
2.01e-06
80
244
2.5
L8
GO:0006403
RNA localization
0.99
0.886
0.141
8.39e-26
8.39e-26
110
211
5.7
GO:0051169
nuclear transport
0.00854
0.659
0.12
8.28e-21
9.79e-21
133
310
3.95
L9
GO:0006338
chromatin remodeling
0.962
0.986
0.175
1.73e-10
2.29e-10
59
134
4.03
GO:0006260
DNA replication
0.0117
0.678
0.14
1.84e-09
3.17e-09
85
232
2.98
GO:0071824
protein-DNA complex subunit organization
0.0112
0.748
0.156
5.24e-14
5.54e-14
80
180
4.13
GO:0016569
covalent chromatin modification
0.0065
0.518
0.109
4.55e-11
5.77e-11
131
387
2.67
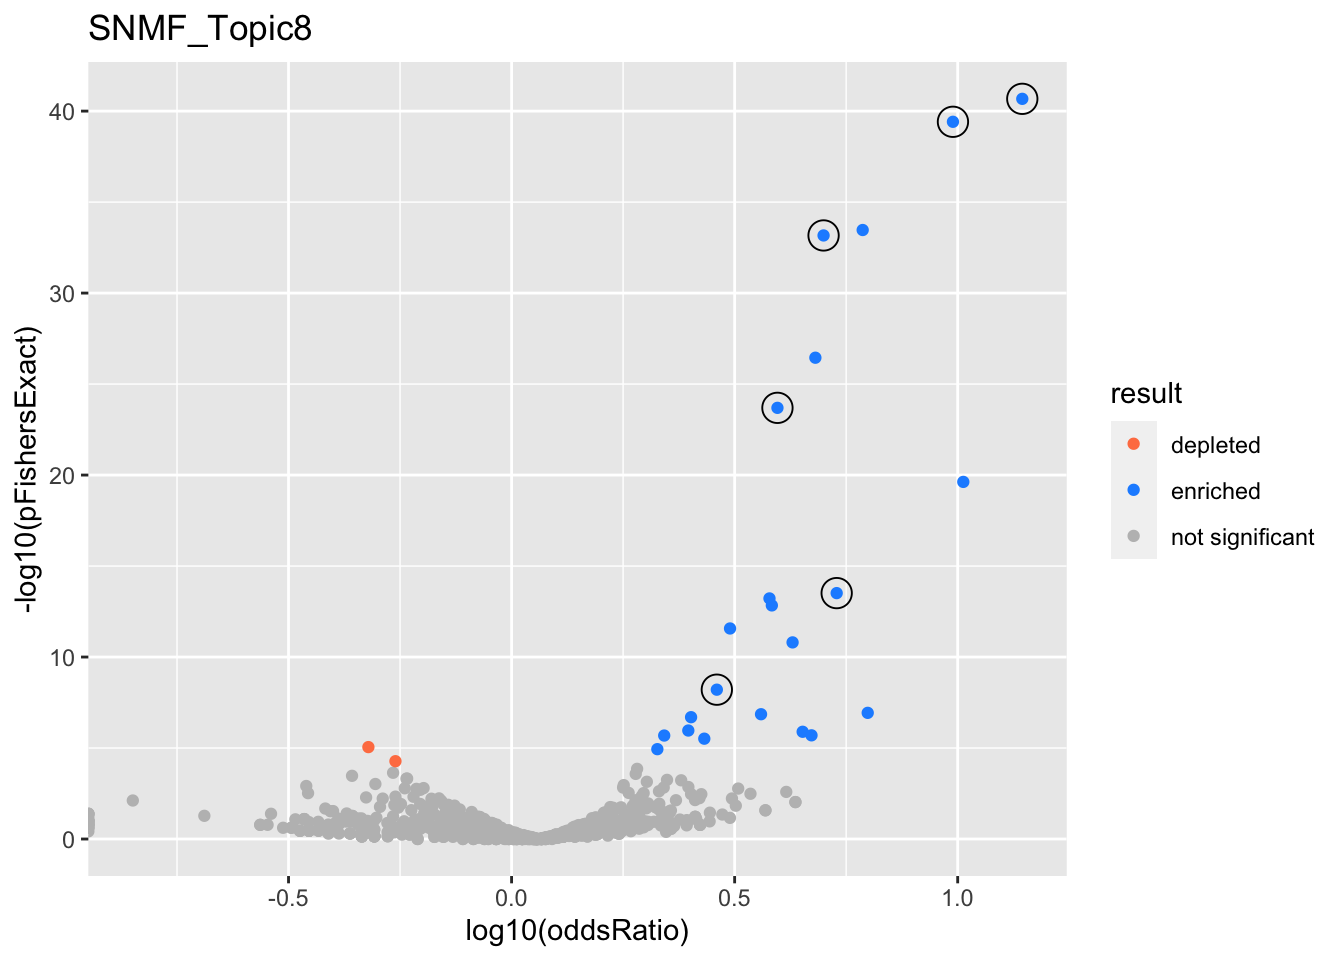
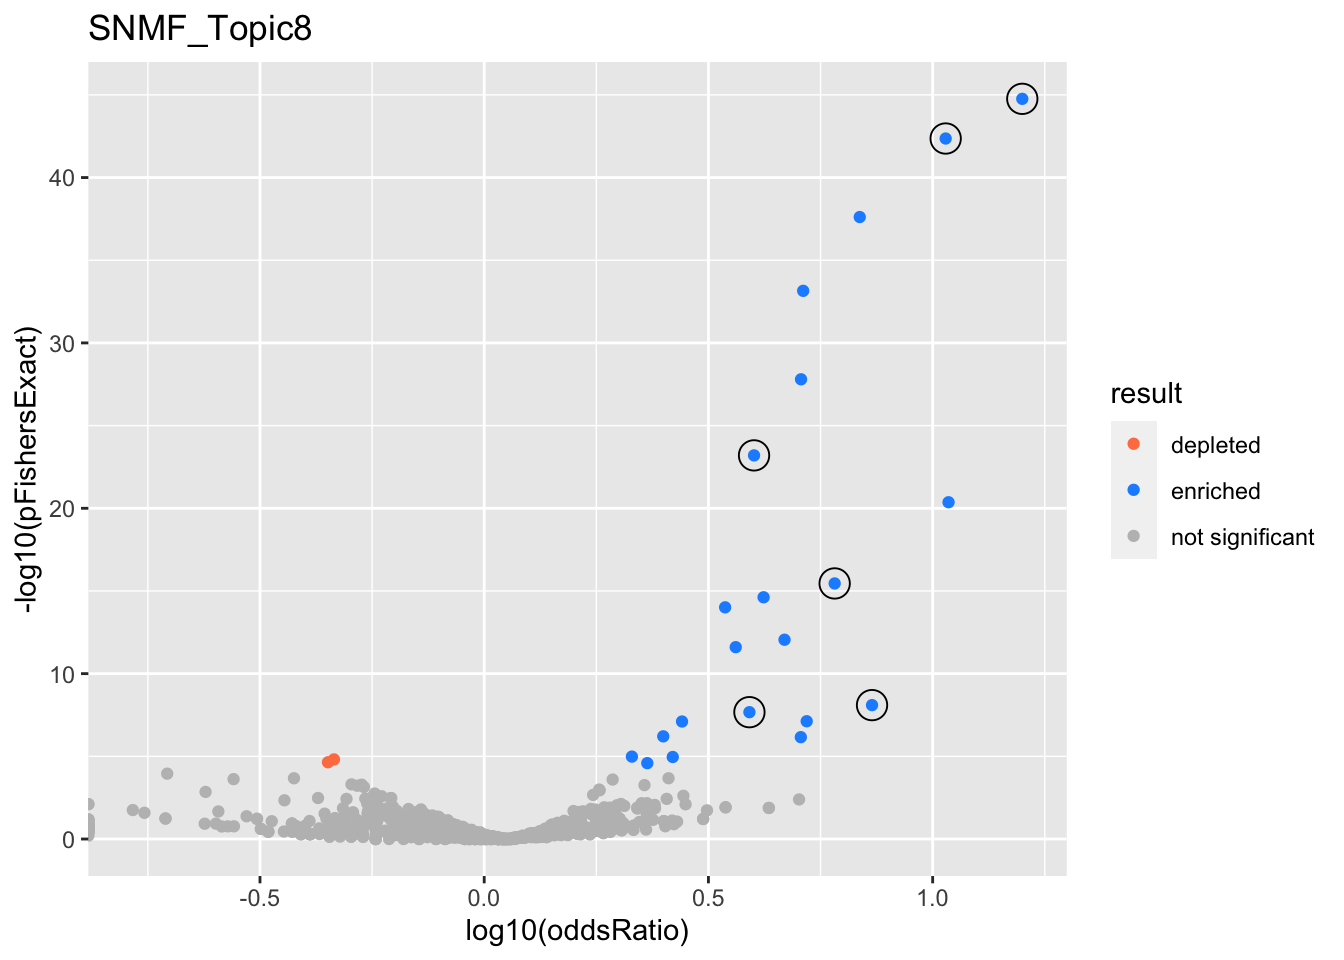
SNMF_Topic8
Past versions of snmf.results-7.png
Version
Author
Date
a102c2d
karltayeb
2022-04-13
<<<<<<< HEAD
topic_5
gobp
=======
gobp_nr
>>>>>>> 689eb11fb5dbc931eb8b6b4a5c5efa65bad315c1
geneSet
description
alpha
beta
beta.se
pHypergeometric
pFishersExact
overlap
geneSetSize
oddsRatio
<<<<<<< HEAD
=======
>>>>>>> 689eb11fb5dbc931eb8b6b4a5c5efa65bad315c1
L1
<<<<<<< HEAD
GO:0044403
symbiont process
0.618
0.103
0.0182
6.29e-09
216
643
2.21
=======
GO:0070972
protein localization to endoplasmic reticulum
0.996
1.08
0.183
2.12e-41
2.12e-41
84
131
14
L2
>>>>>>> 689eb11fb5dbc931eb8b6b4a5c5efa65bad315c1
<<<<<<< HEAD
GO:0044419
interspecies interaction between organisms
0.235
0.0999
0.0182
2.79e-08
217
657
2.16
=======
GO:0022613
ribonucleoprotein complex biogenesis
1
0.881
0.106
1.96e-24
2.03e-24
130
391
3.94
L3
>>>>>>> 689eb11fb5dbc931eb8b6b4a5c5efa65bad315c1
<<<<<<< HEAD
GO:0016032
viral process
0.144
0.0983
0.0182
1.65e-08
202
600
2.21
L2
=======
GO:0006414
translational elongation
1
1.52
0.183
3.07e-14
3.07e-14
50
121
5.35
L4
>>>>>>> 689eb11fb5dbc931eb8b6b4a5c5efa65bad315c1
<<<<<<< HEAD
GO:0006952
defense response
0.993
-0.113
0.019
1
193
1010
0.985
L3
=======
GO:0009141
nucleoside triphosphate metabolic process
0.999
0.979
0.133
4.81e-09
6.22e-09
67
244
2.88
L5
>>>>>>> 689eb11fb5dbc931eb8b6b4a5c5efa65bad315c1
<<<<<<< HEAD
GO:0016192
vesicle-mediated transport
=======
GO:0006413
translational initiation
>>>>>>> 689eb11fb5dbc931eb8b6b4a5c5efa65bad315c1
1
<<<<<<< HEAD
0.144
0.0176
7.09e-15
495
1550
2.17
L4
=======
1.12
0.157
3.87e-40
3.87e-40
98
177
9.76
L6
>>>>>>> 689eb11fb5dbc931eb8b6b4a5c5efa65bad315c1
<<<<<<< HEAD
GO:0009060
aerobic respiration
0.888
0.115
0.0185
1.96e-10
40
66
6.52
GO:0045333
cellular respiration
0.103
0.109
0.0187
1.12e-10
70
145
3.98
L5
=======
GO:0006605
protein targeting
1
0.865
0.11
6.81e-34
6.81e-34
140
364
5
>>>>>>> 689eb11fb5dbc931eb8b6b4a5c5efa65bad315c1
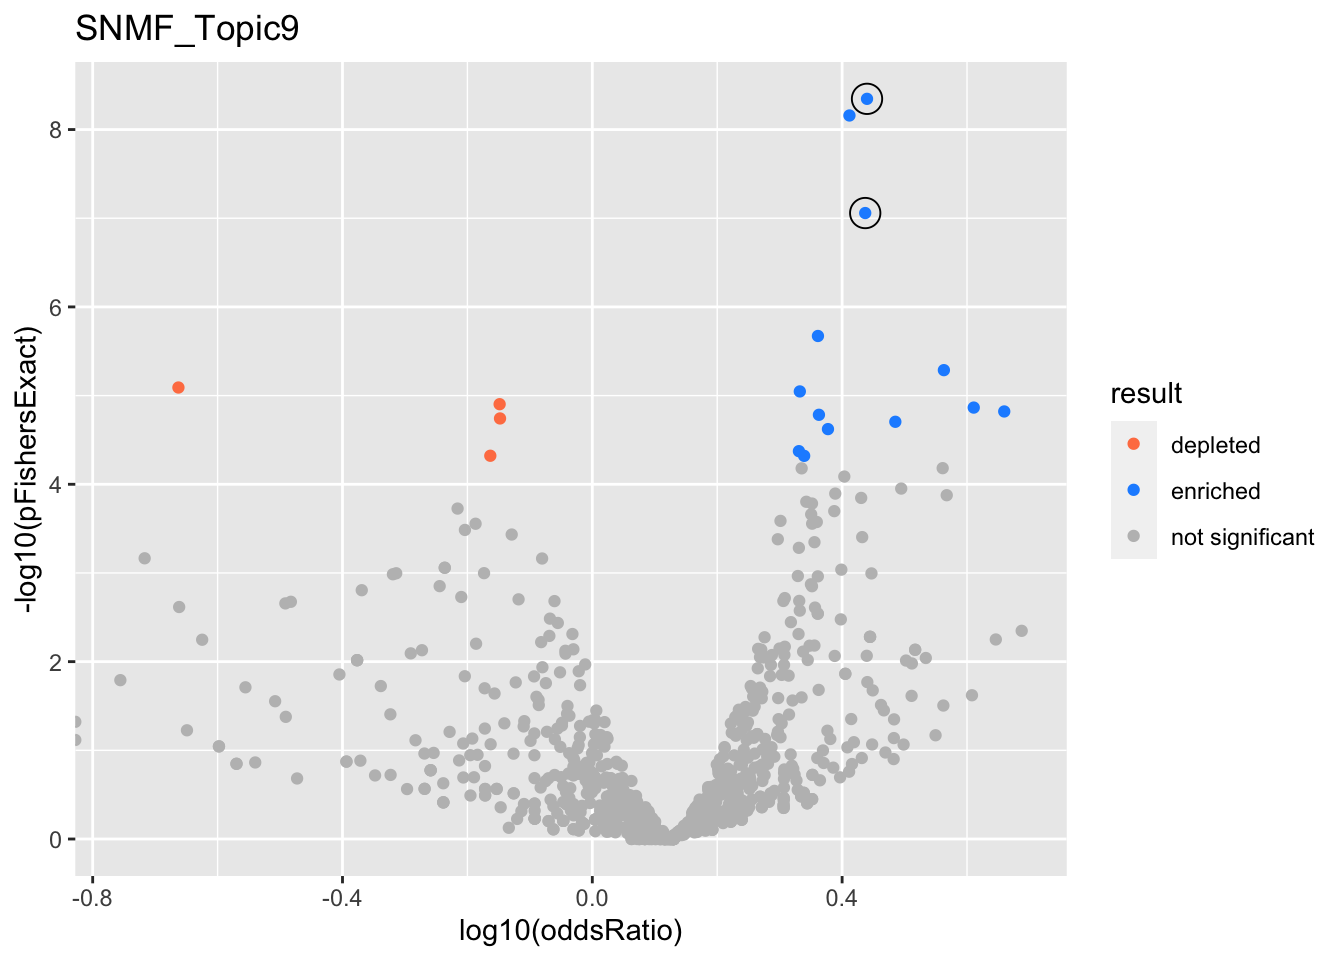
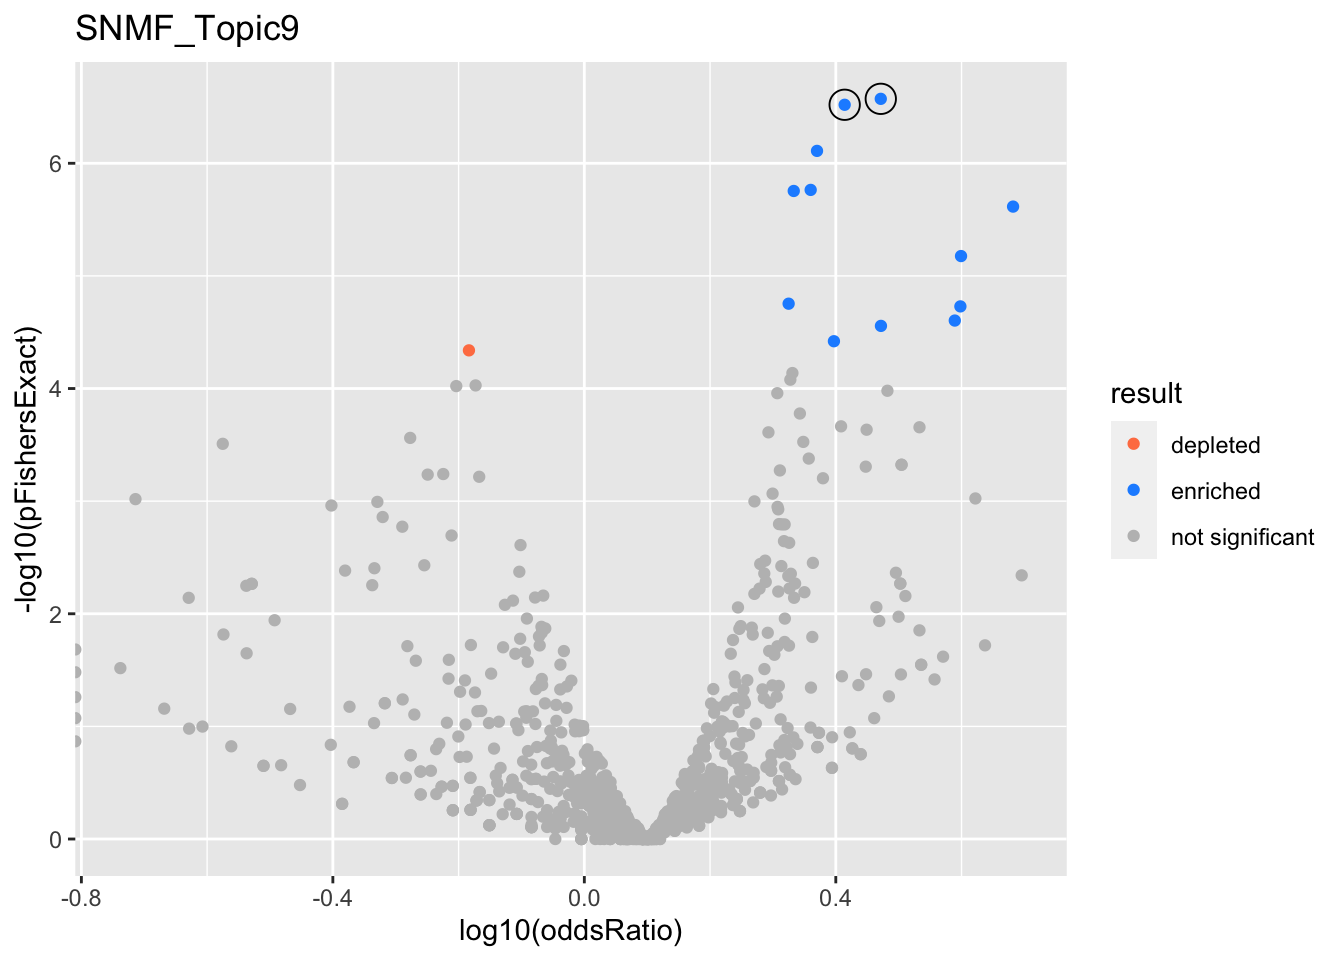
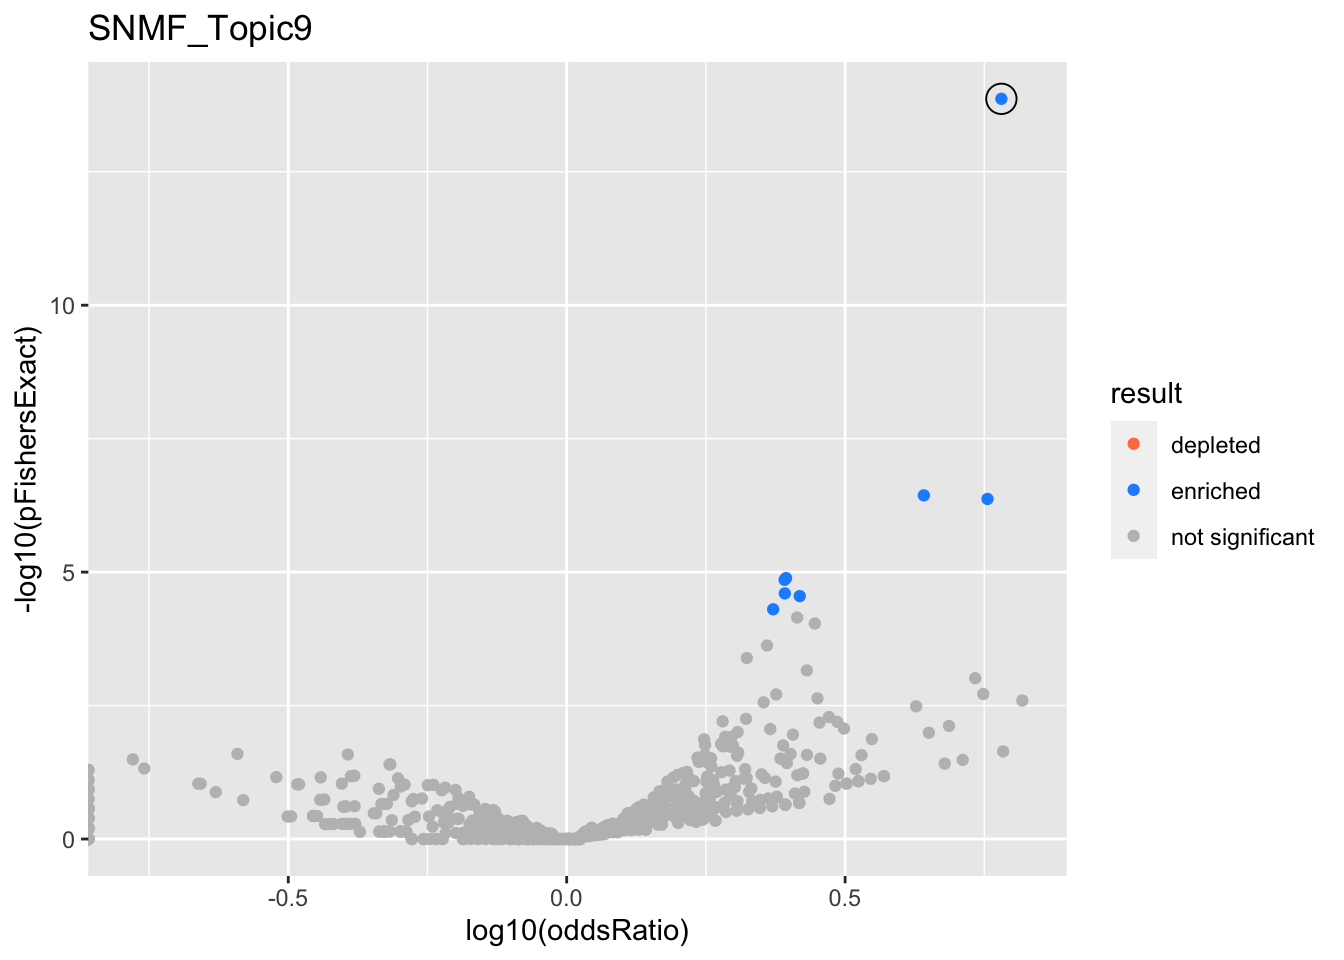
SNMF_Topic9
Past versions of snmf.results-8.png
<<<<<<< HEAD
GO:0010469
regulation of signaling receptor activity
1
-0.129
0.0207
1
40
330
0.571
L6
=======
Version
Author
Date
>>>>>>> 689eb11fb5dbc931eb8b6b4a5c5efa65bad315c1
<<<<<<< HEAD
GO:0006996
organelle organization
1
0.155
0.0164
4.63e-20
897
2980
2.19
=======
a102c2d
karltayeb
2022-04-13
>>>>>>> 689eb11fb5dbc931eb8b6b4a5c5efa65bad315c1
gobp_nr
geneSet
description
alpha
beta
beta.se
pHypergeometric
pFishersExact
overlap
geneSetSize
oddsRatio
L1
<<<<<<< HEAD
GO:0004888
transmembrane signaling receptor activity
=======
GO:0006401
RNA catabolic process
>>>>>>> 689eb11fb5dbc931eb8b6b4a5c5efa65bad315c1
0.999
<<<<<<< HEAD
-0.24
0.0215
1
=======
0.694
0.114
2.96e-09
4.51e-09
>>>>>>> 689eb11fb5dbc931eb8b6b4a5c5efa65bad315c1
47
<<<<<<< HEAD
527
0.399
L2
=======
304
2.75
L2
GO:0006520
cellular amino acid metabolic process
0.999
0.707
0.125
6.39e-08
8.74e-08
101
254
2.74
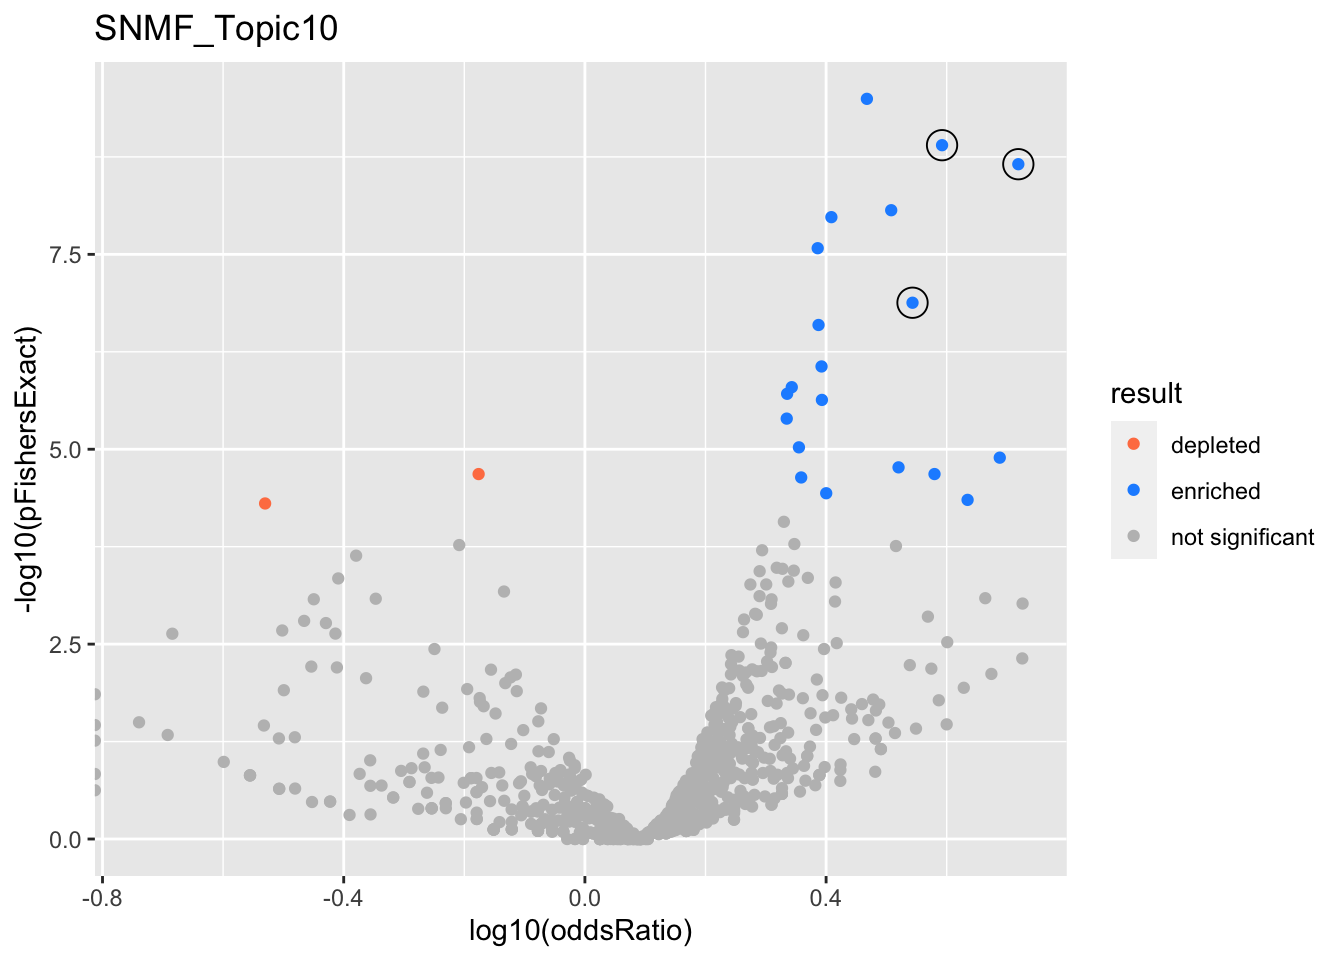
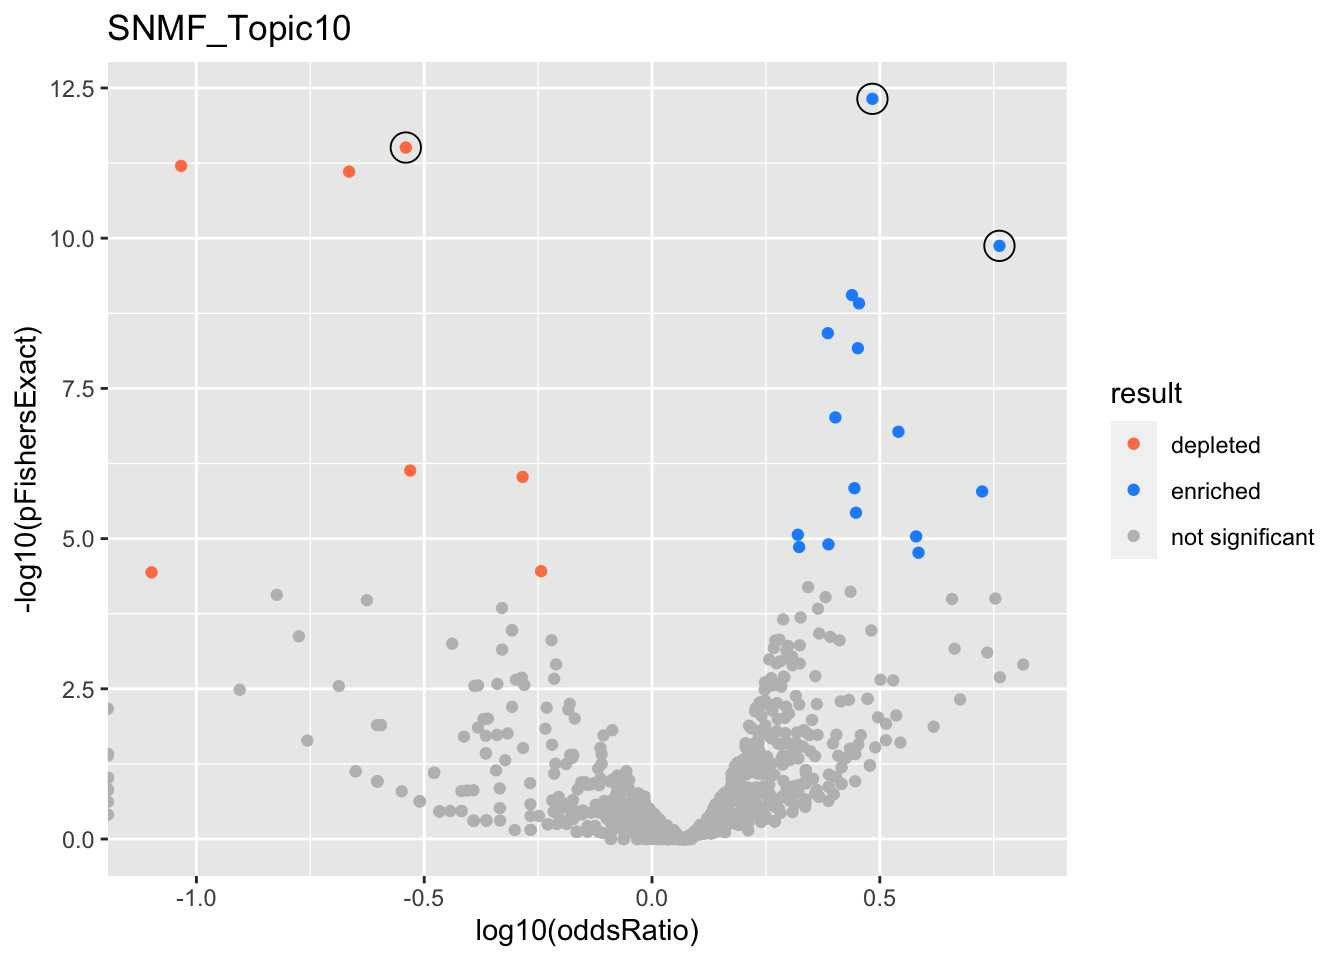
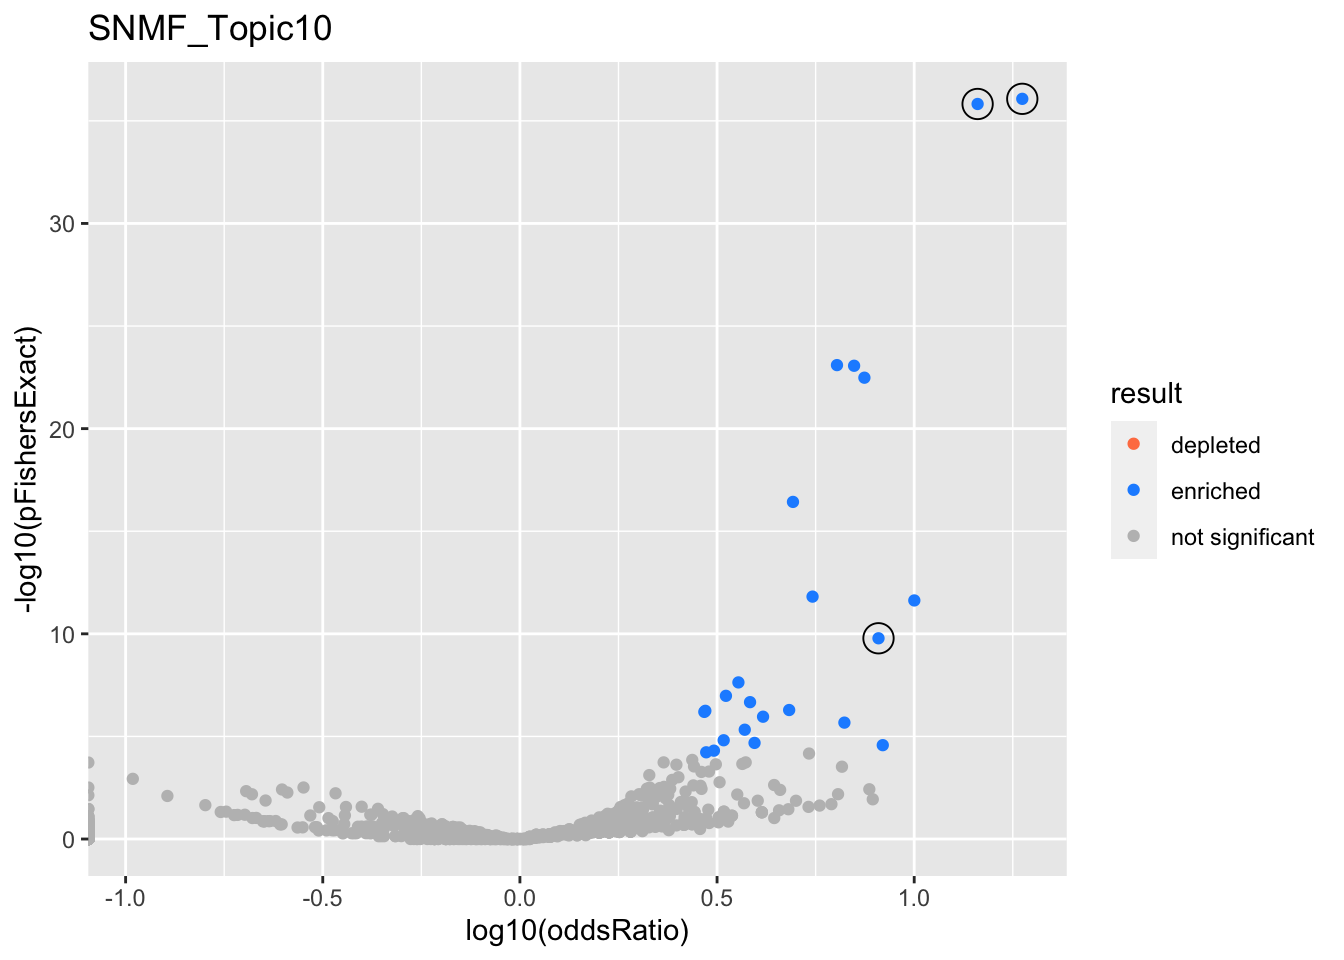
SNMF_Topic10
Past versions of snmf.results-9.png
Version
Author
Date
a102c2d
karltayeb
2022-04-13
gobp_nr
geneSet
description
alpha
beta
beta.se
pHypergeometric
pFishersExact
overlap
geneSetSize
oddsRatio
L1
>>>>>>> 689eb11fb5dbc931eb8b6b4a5c5efa65bad315c1
<<<<<<< HEAD
GO:0045296
cadherin binding
=======
GO:0070972
protein localization to endoplasmic reticulum
>>>>>>> 689eb11fb5dbc931eb8b6b4a5c5efa65bad315c1
0.962
<<<<<<< HEAD
0.16
0.0183
7.12e-20
137
282
4.1
L3
=======
1.14
0.174
7.35e-10
1.26e-09
55
131
3.91
>>>>>>> 689eb11fb5dbc931eb8b6b4a5c5efa65bad315c1
<<<<<<< HEAD
GO:0022836
gated channel activity
0.584
-0.109
0.0209
1
25
244
0.473
=======
GO:0090150
establishment of protein localization to membrane
0.0299
0.775
0.128
2.63e-10
3.2e-10
93
266
2.94
L2
>>>>>>> 689eb11fb5dbc931eb8b6b4a5c5efa65bad315c1
<<<<<<< HEAD
GO:0022839
ion gated channel activity
0.221
-0.105
0.0209
1
25
237
0.488
=======
GO:0048013
ephrin receptor signaling pathway
0.998
1.26
0.229
2.21e-09
2.21e-09
37
75
5.23
L3
>>>>>>> 689eb11fb5dbc931eb8b6b4a5c5efa65bad315c1
<<<<<<< HEAD
GO:0005216
ion channel activity
0.0451
-0.0961
0.0205
1
37
295
0.594
=======
GO:0038127
ERBB signaling pathway
0.971
0.893
0.181
1.02e-07
1.32e-07
48
122
3.49
>>>>>>> 689eb11fb5dbc931eb8b6b4a5c5efa65bad315c1
<<<<<<< HEAD
GO:0022843
voltage-gated cation channel activity
0.0388
-0.0965
0.0207
1
6
100
0.265
=======
GO:0070671
response to interleukin-12
0.00272
1.04
0.305
1.28e-05
1.28e-05
21
44
4.88
>>>>>>> 689eb11fb5dbc931eb8b6b4a5c5efa65bad315c1
<<<<<<< HEAD
GO:0022803
passive transmembrane transporter activity
0.0282
-0.0934
0.0203
1
43
324
0.634
=======
GO:1990823
response to leukemia inhibitory factor
0.00161
0.737
0.221
1.53e-05
1.71e-05
34
89
3.31
>>>>>>> 689eb11fb5dbc931eb8b6b4a5c5efa65bad315c1
<<<<<<< HEAD
GO:0015267
channel activity
0.0256
-0.0929
0.0203
1
43
323
0.636
=======
GO:0034109
homotypic cell-cell adhesion
0.00152
0.836
0.255
1.96e-05
2.08e-05
27
65
3.8
>>>>>>> 689eb11fb5dbc931eb8b6b4a5c5efa65bad315c1
<<<<<<< HEAD
GO:0005261
cation channel activity
0.0214
-0.0931
0.0206
1
27
231
0.549
L4
=======
GO:0007015
actin filament organization
0.00131
0.404
0.117
6.55e-09
1.05e-08
105
329
2.56
>>>>>>> 689eb11fb5dbc931eb8b6b4a5c5efa65bad315c1
<<<<<<< HEAD
GO:0048018
receptor ligand activity
0.984
-0.18
0.0217
1
22
258
0.385
L5
=======
GO:0046847
filopodium assembly
0.00118
0.933
0.296
4.46e-05
4.46e-05
21
47
4.31
GO:0034330
cell junction organization
0.000818
0.442
0.134
1.32e-06
2.33e-06
78
249
2.47
GO:0002446
neutrophil mediated immunity
0.000789
0.362
0.108
1.08e-06
1.6e-06
111
386
2.2
>>>>>>> 689eb11fb5dbc931eb8b6b4a5c5efa65bad315c1
<<<<<<< HEAD
GO:0051020
GTPase binding
0.941
0.117
0.0183
2.3e-09
191
548
2.33
=======
GO:0008544
epidermis development
0.000718
0.433
0.133
1.6e-05
2.3e-05
76
256
2.28
>>>>>>> 689eb11fb5dbc931eb8b6b4a5c5efa65bad315c1
<<<<<<< HEAD
GO:0031267
small GTPase binding
0.0365
0.108
0.0184
7.84e-08
162
469
2.28
=======
GO:0072337
modified amino acid transport
0.000602
1.16
0.412
0.000954
0.000954
11
22
5.32
SNMF_Topic11
Past versions of snmf.results-10.png
Version
Author
Date
a102c2d
karltayeb
2022-04-13
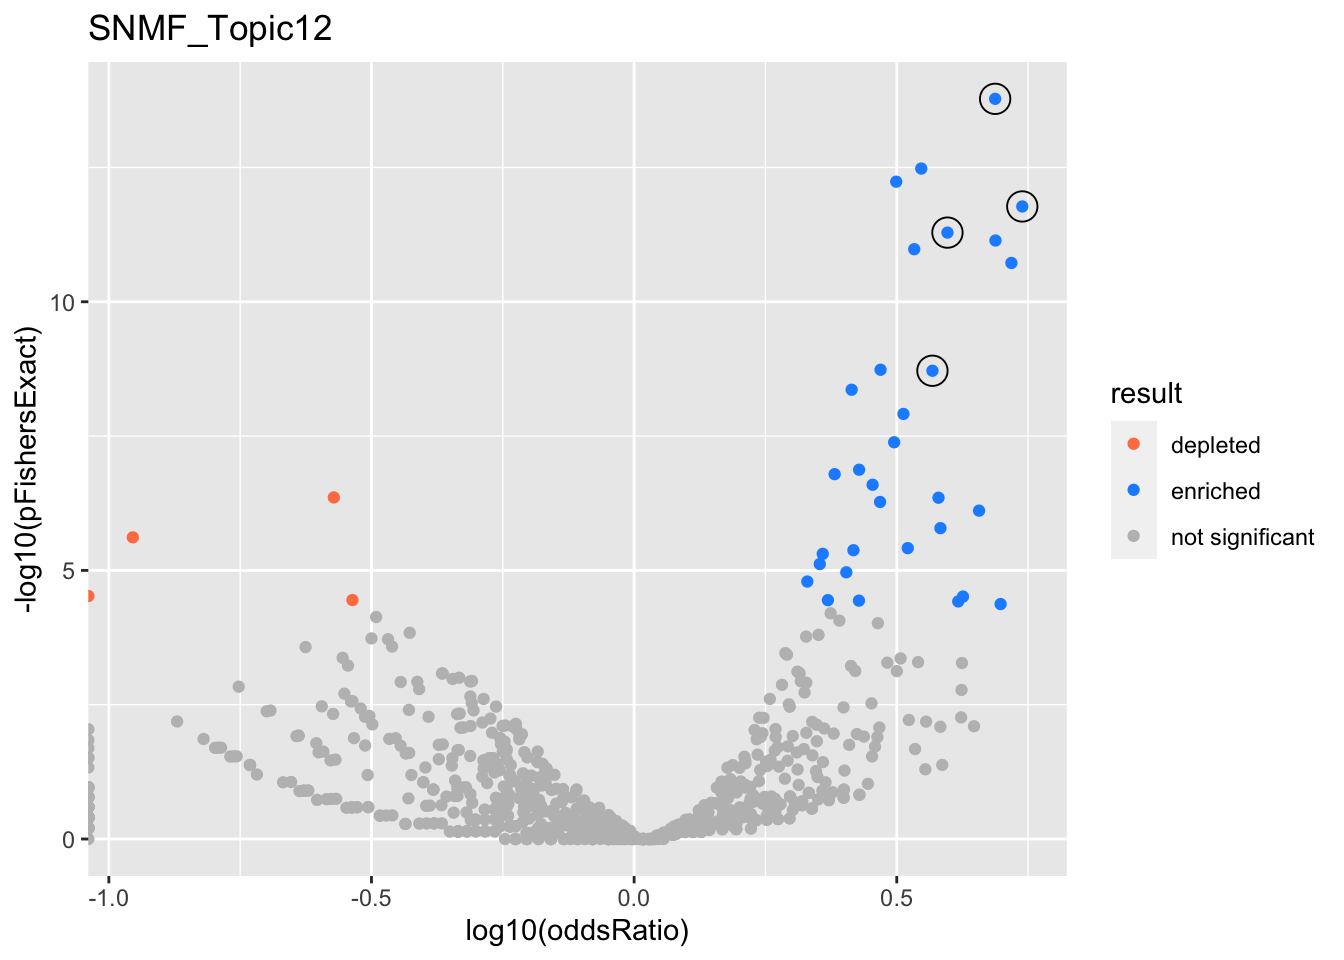
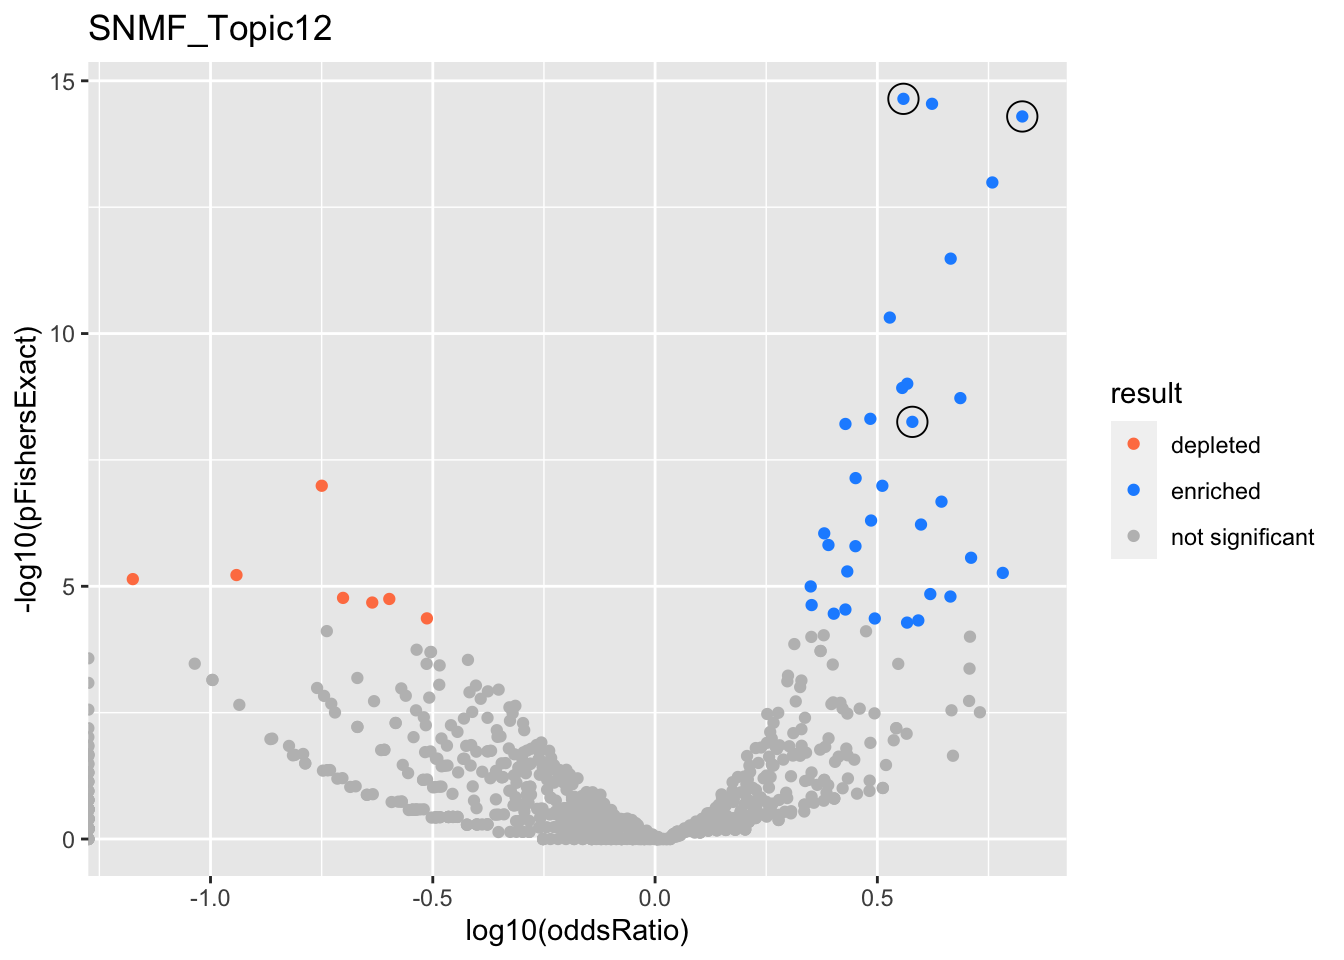
SNMF_Topic12
Past versions of snmf.results-11.png
Version
Author
Date
a102c2d
karltayeb
2022-04-13
>>>>>>> 689eb11fb5dbc931eb8b6b4a5c5efa65bad315c1
<<<<<<< HEAD
kegg
=======
gobp_nr
>>>>>>> 689eb11fb5dbc931eb8b6b4a5c5efa65bad315c1
geneSet
description
alpha
beta
beta.se
pHypergeometric
pFishersExact
overlap
geneSetSize
oddsRatio
L1
<<<<<<< HEAD
hsa04144
Endocytosis
=======
GO:0006413
translational initiation
>>>>>>> 689eb11fb5dbc931eb8b6b4a5c5efa65bad315c1
1
<<<<<<< HEAD
0.186
0.0267
6.52e-11
95
210
3.48
=======
1.4
0.157
1.67e-14
1.67e-14
48
177
4.87
L2
GO:0006414
translational elongation
0.999
1.61
0.187
1.68e-12
1.68e-12
36
121
5.48
>>>>>>> 689eb11fb5dbc931eb8b6b4a5c5efa65bad315c1
L3
<<<<<<< HEAD
hsa04080
Neuroactive ligand-receptor interaction
1
-0.279
0.0337
1
9
163
0.228
=======
GO:0006403
RNA localization
0.998
1.15
0.146
5.16e-12
5.16e-12
49
211
3.95
>>>>>>> 689eb11fb5dbc931eb8b6b4a5c5efa65bad315c1
L4
<<<<<<< HEAD
hsa04060
Cytokine-cytokine receptor interaction
=======
GO:0071824
protein-DNA complex subunit organization
>>>>>>> 689eb11fb5dbc931eb8b6b4a5c5efa65bad315c1
1
<<<<<<< HEAD
-0.24
0.0324
=======
1.2
0.158
>>>>>>> 689eb11fb5dbc931eb8b6b4a5c5efa65bad315c1
1.92e-09
<<<<<<< HEAD
13
173
0.318
L5
=======
1.92e-09
40
180
3.7
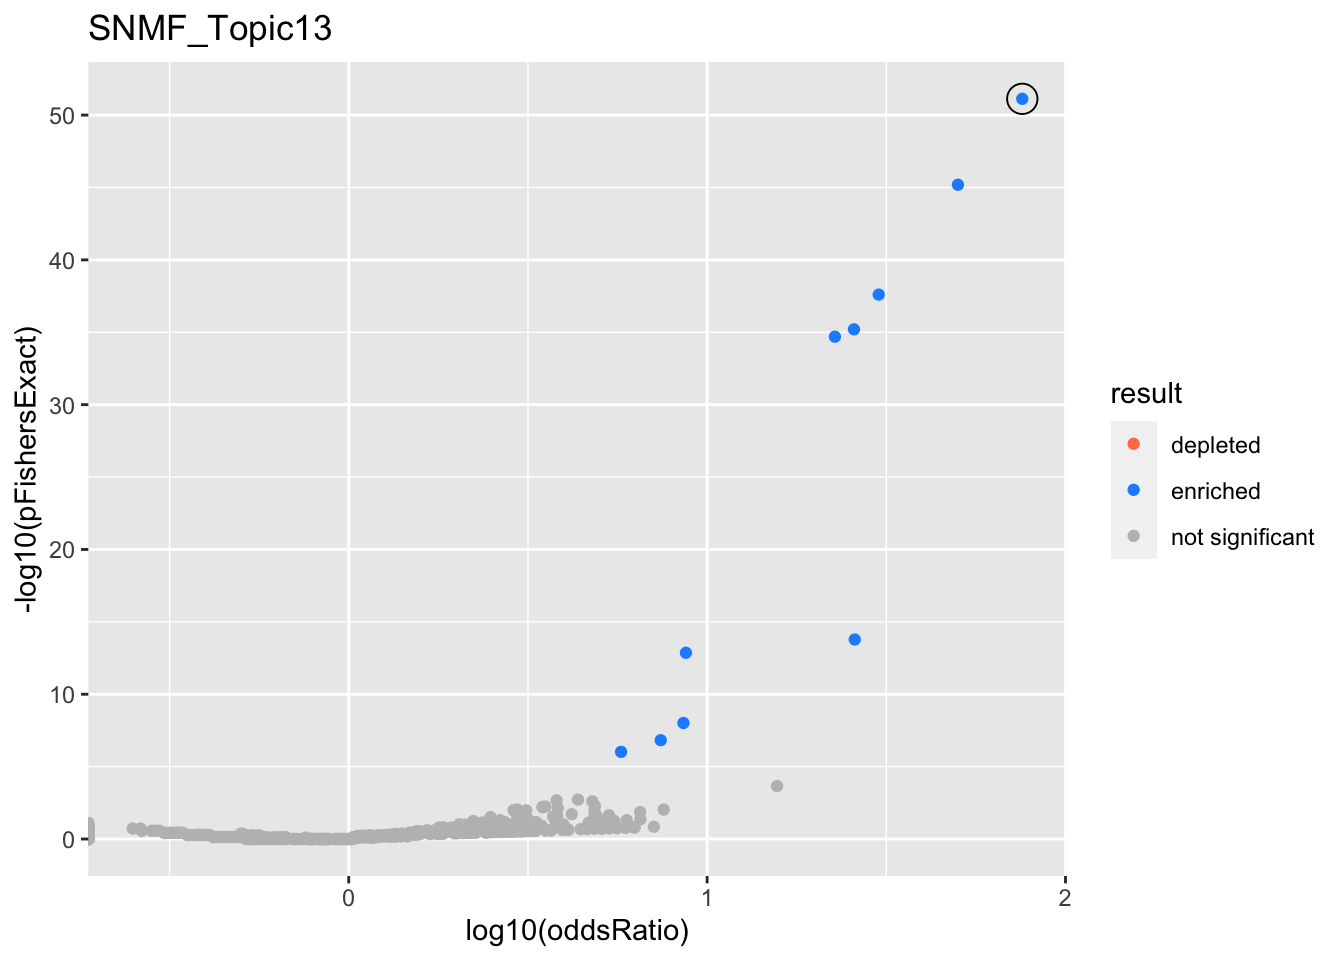
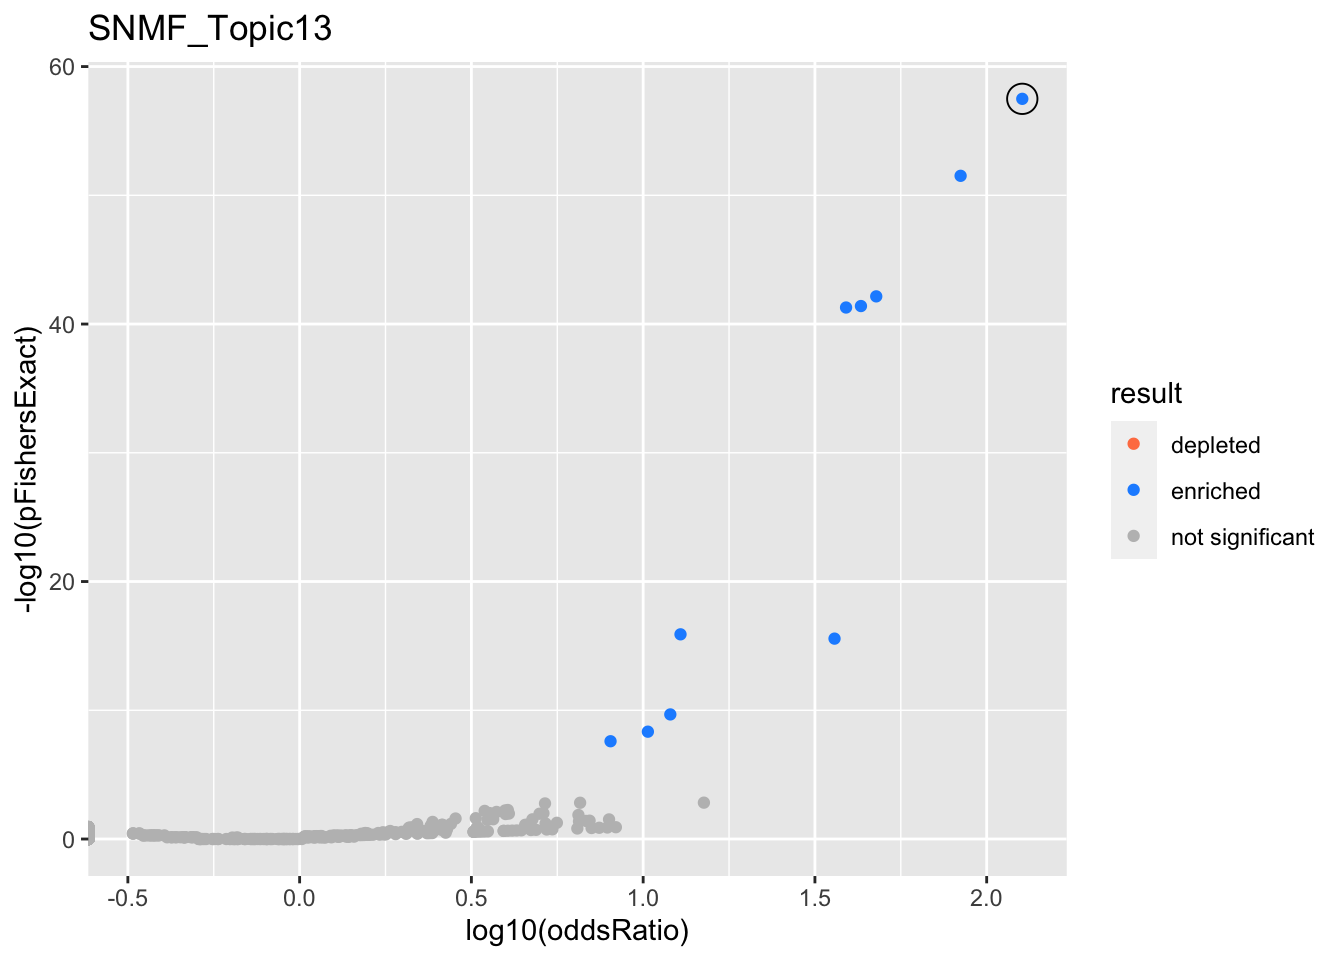
SNMF_Topic13
Past versions of snmf.results-12.png
Version
Author
Date
a102c2d
karltayeb
2022-04-13
gobp_nr
geneSet
description
alpha
beta
beta.se
pHypergeometric
pFishersExact
overlap
geneSetSize
oddsRatio
L1
>>>>>>> 689eb11fb5dbc931eb8b6b4a5c5efa65bad315c1
<<<<<<< HEAD
hsa05010
Alzheimer disease
0.91
0.146
0.0269
4.27e-08
65
142
3.49
hsa05012
Parkinson disease
0.0461
0.132
0.0272
5.13e-07
50
106
3.67
L6
=======
GO:0070972
protein localization to endoplasmic reticulum
1
4.29
0.18
7.55e-52
7.55e-52
40
131
75.8
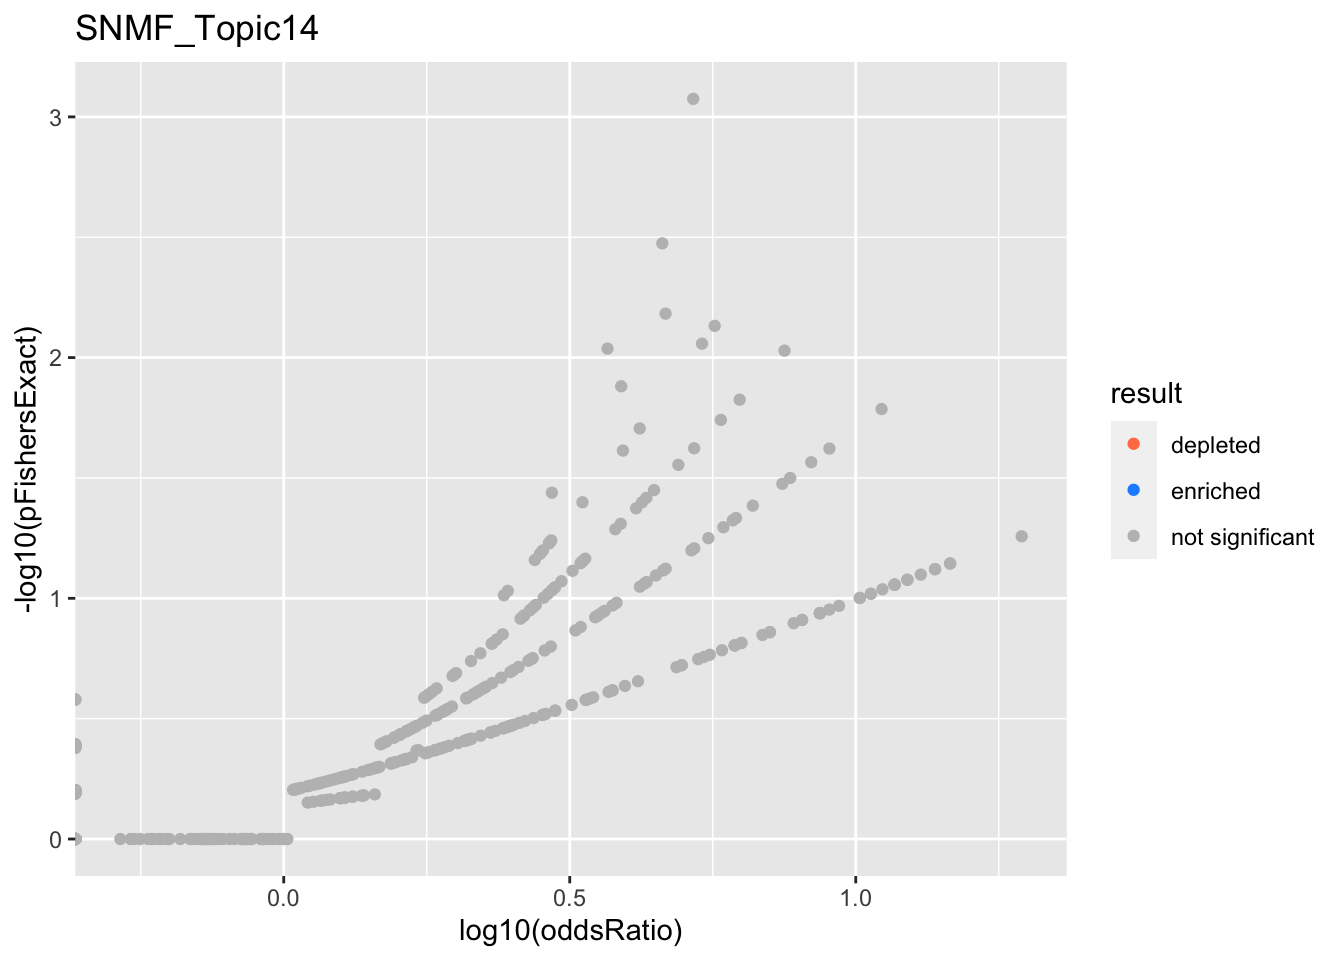
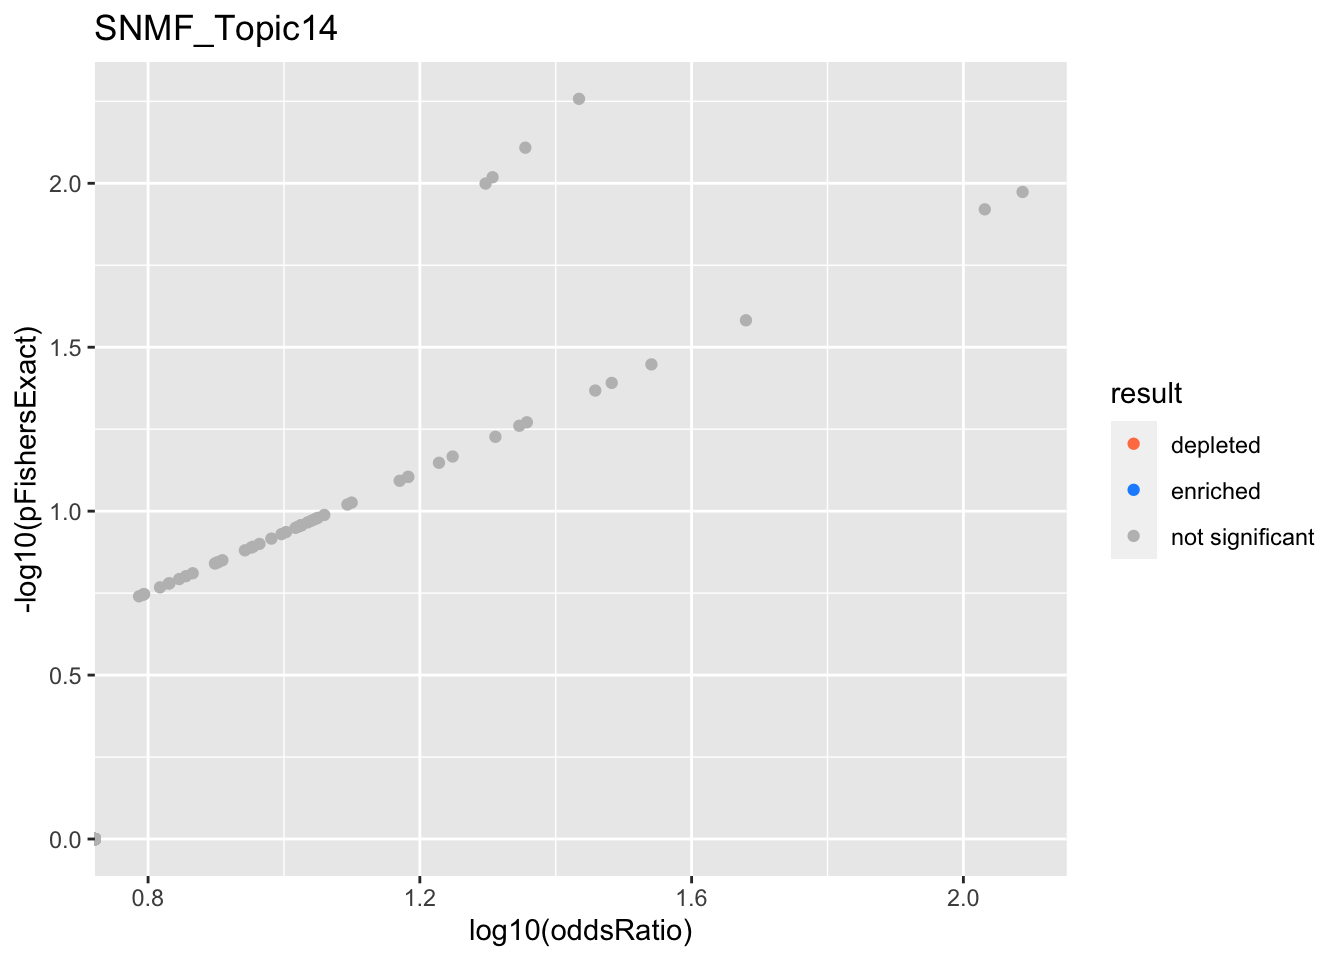
SNMF_Topic14
Past versions of snmf.results-13.png
Version
Author
Date
a102c2d
karltayeb
2022-04-13
>>>>>>> 689eb11fb5dbc931eb8b6b4a5c5efa65bad315c1
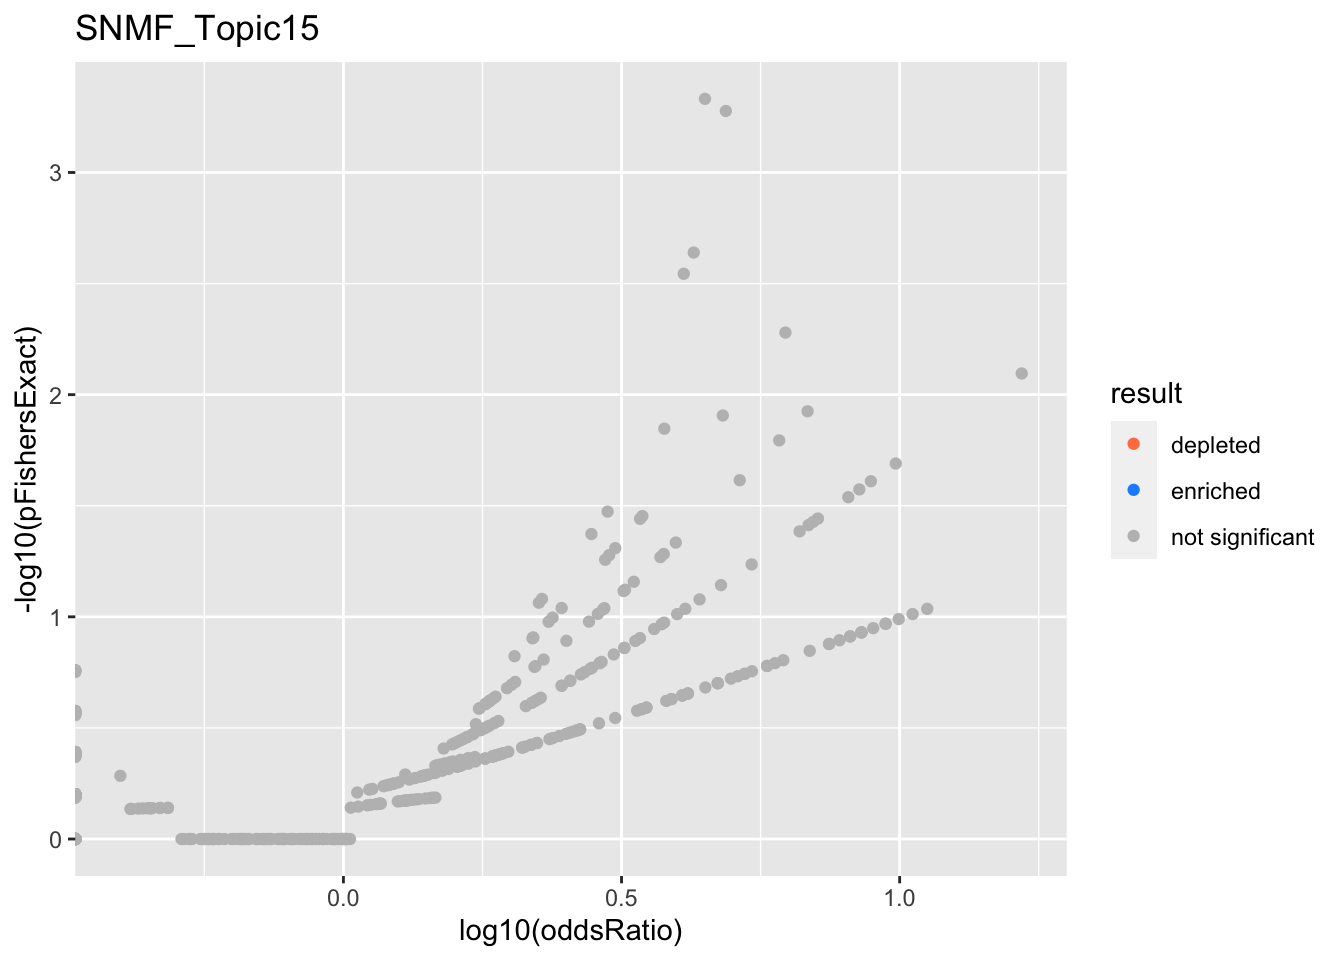
SNMF_Topic15
Past versions of snmf.results-14.png
<<<<<<< HEAD
hsa01200
Carbon metabolism
0.984
0.141
0.0268
2.09e-07
48
98
3.94
=======
Version
Author
Date
a102c2d
karltayeb
2022-04-13
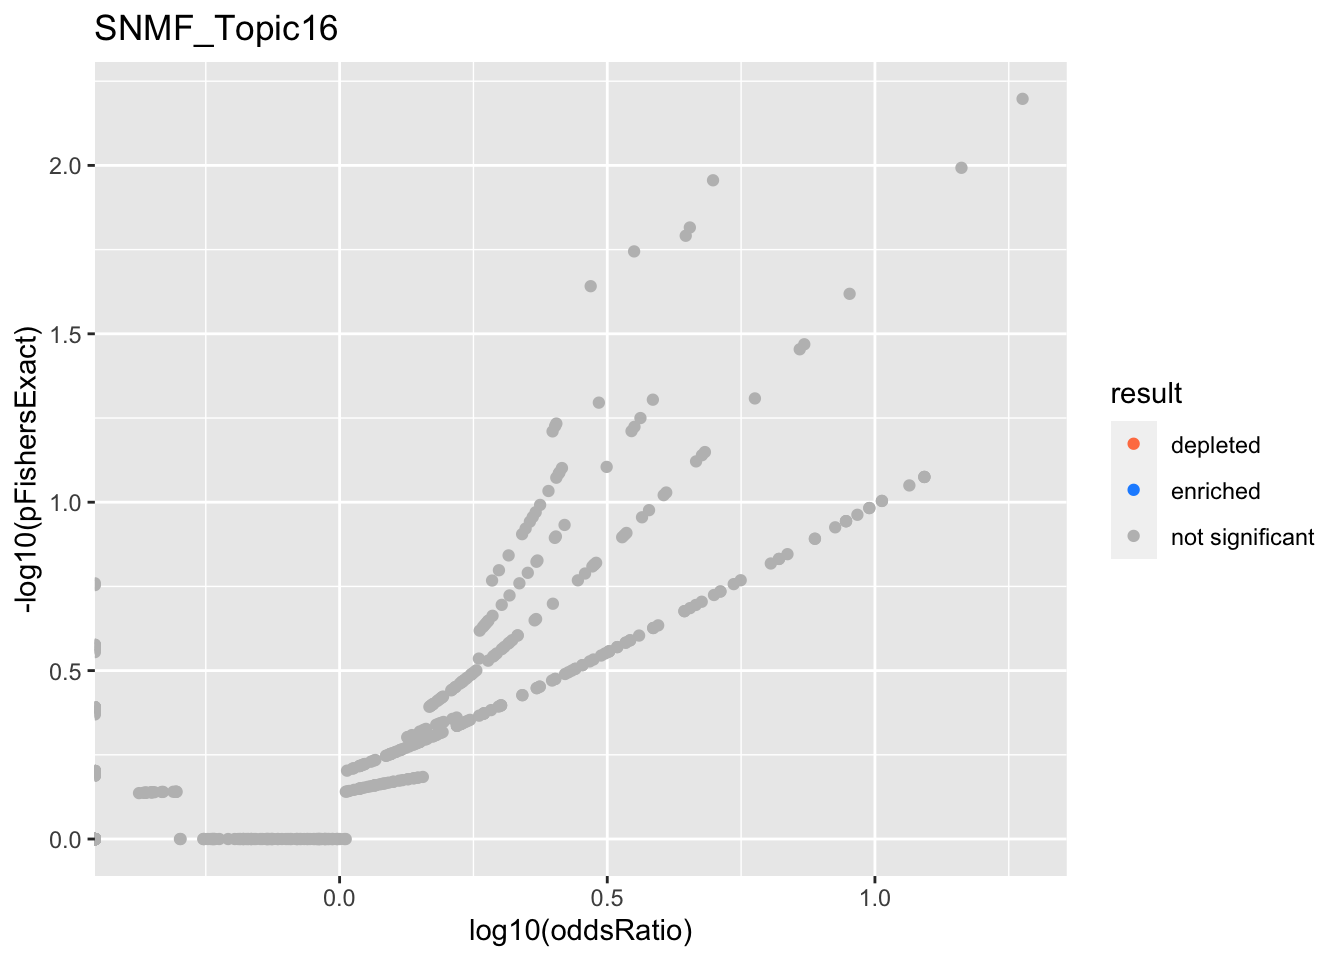
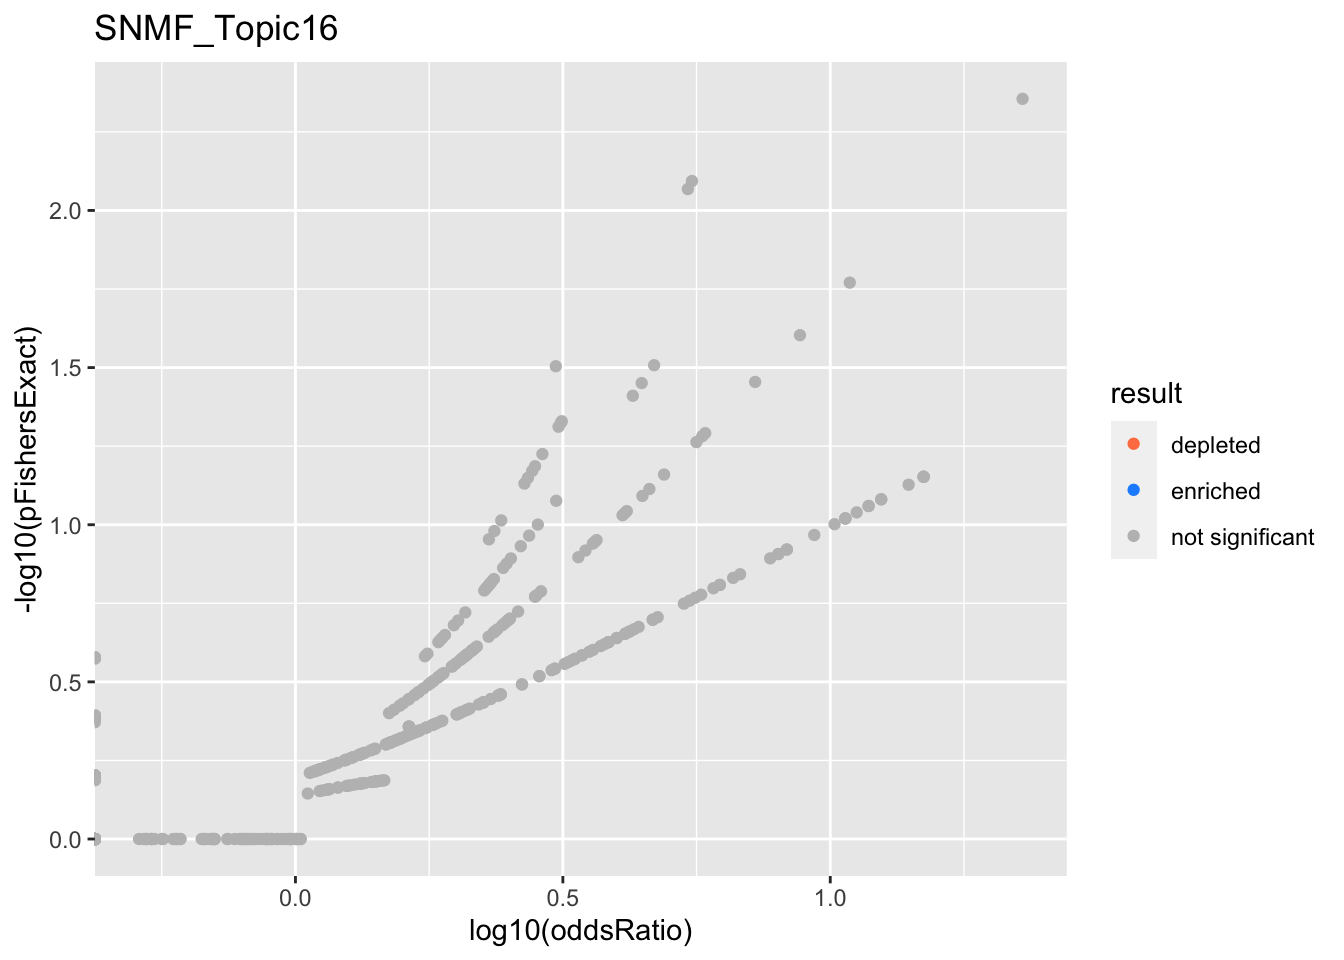
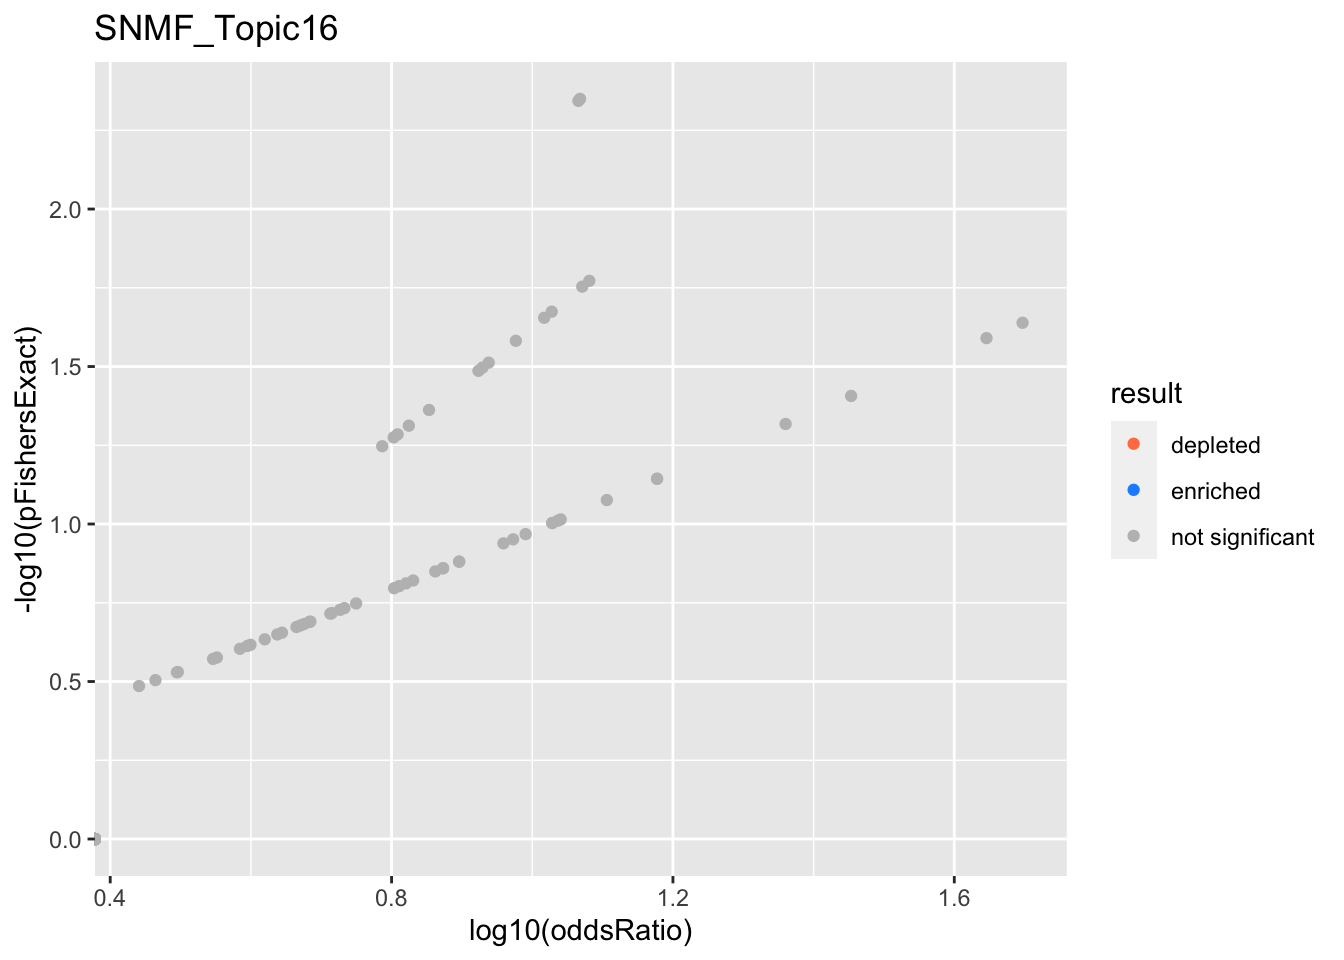
SNMF_Topic16
Past versions of snmf.results-15.png
Version
Author
Date
a102c2d
karltayeb
2022-04-13
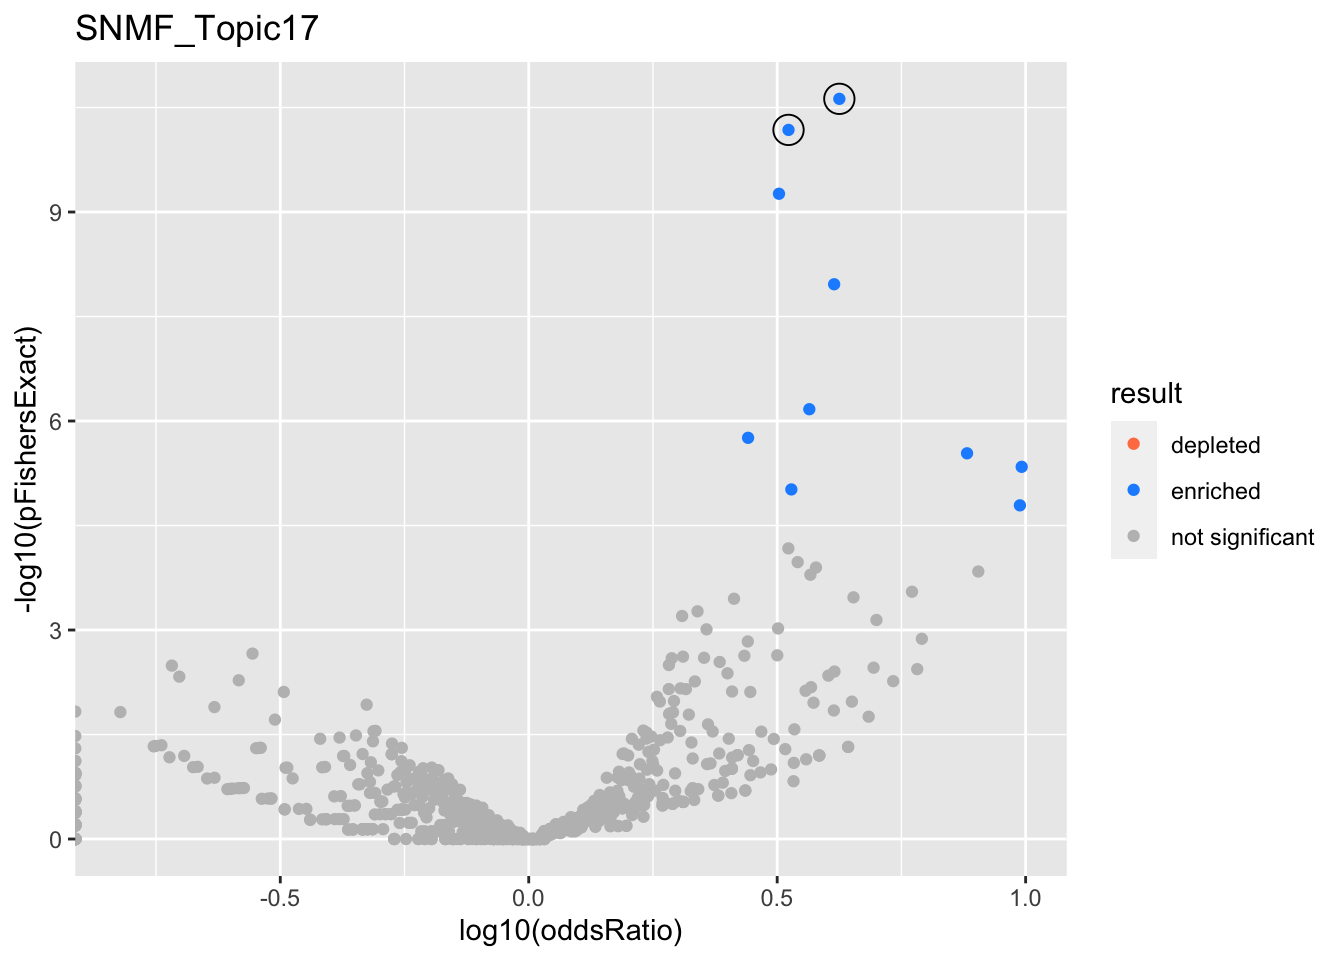
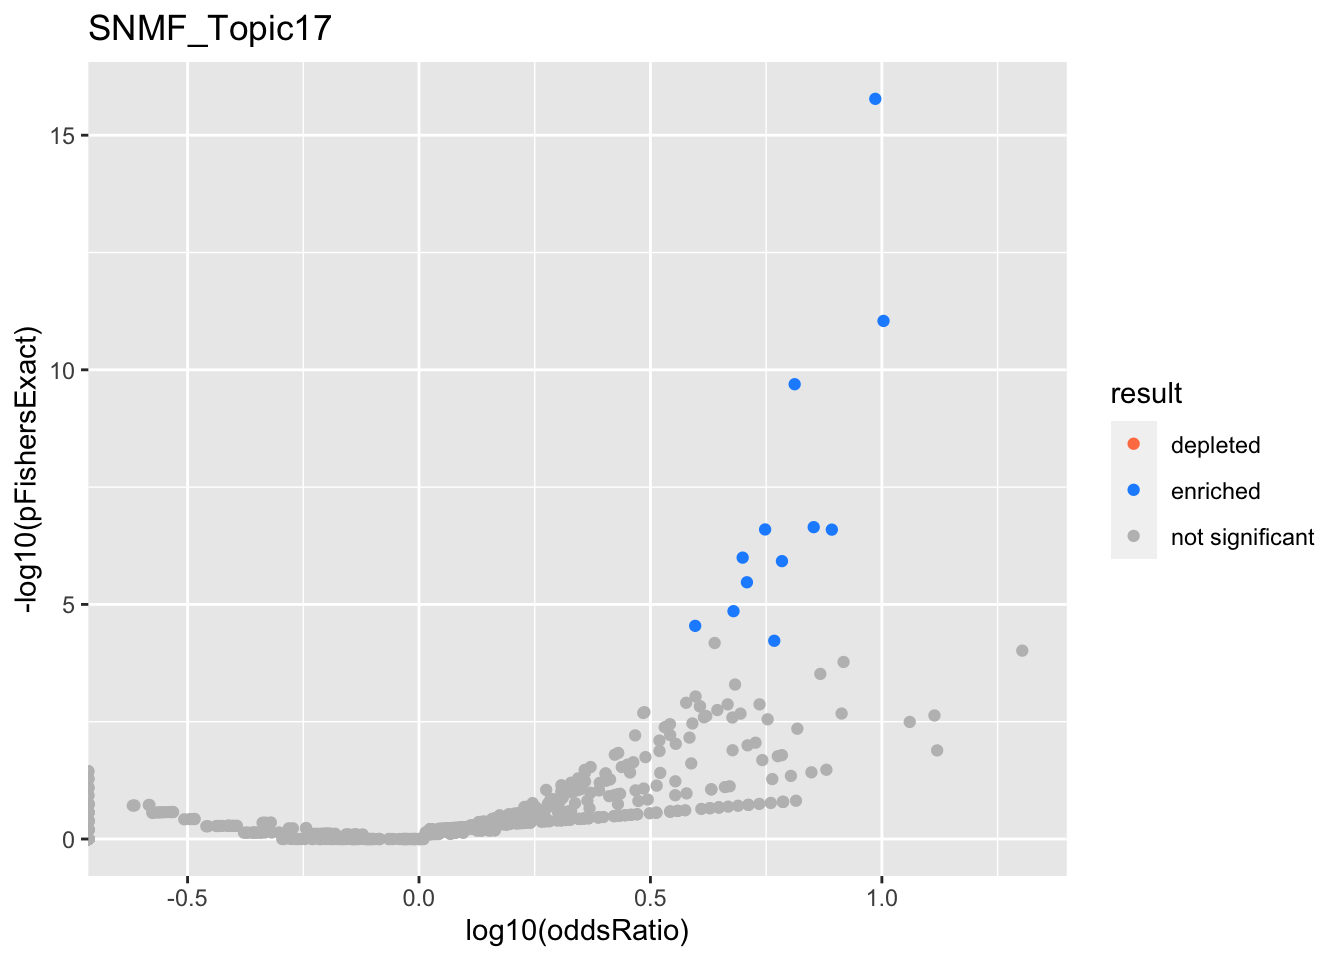
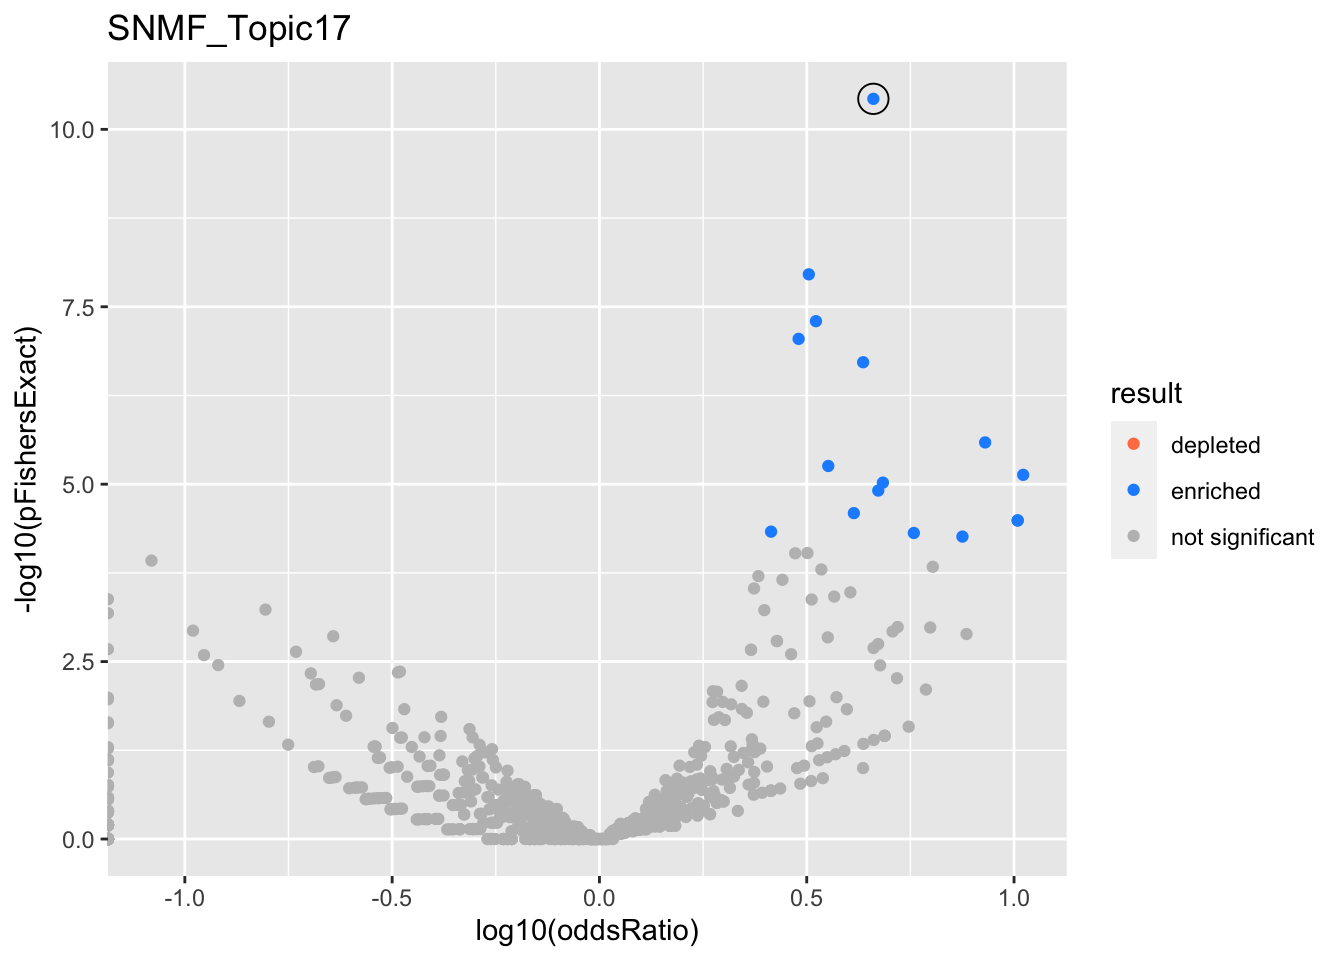
SNMF_Topic17
Past versions of snmf.results-16.png
Version
Author
Date
a102c2d
karltayeb
2022-04-13
>>>>>>> 689eb11fb5dbc931eb8b6b4a5c5efa65bad315c1
gobp_nr
geneSet
description
alpha
beta
beta.se
pHypergeometric
pFishersExact
overlap
geneSetSize
oddsRatio
<<<<<<< HEAD
L7
=======
L1
>>>>>>> 689eb11fb5dbc931eb8b6b4a5c5efa65bad315c1
<<<<<<< HEAD
hsa04530
Tight junction
=======
GO:0034976
response to endoplasmic reticulum stress
>>>>>>> 689eb11fb5dbc931eb8b6b4a5c5efa65bad315c1
0.994
<<<<<<< HEAD
0.133
0.0267
2.11e-07
64
144
3.31
topic_10
gobp
geneSet
description
alpha
beta
beta.se
pValueHypergeometric
overlap
geneSetSize
oddsRatio
L1
=======
1.38
0.143
2.37e-11
2.37e-11
39
239
4.22
L2
GO:0002446
neutrophil mediated immunity
0.959
1.14
0.115
6.63e-11
6.63e-11
51
386
3.33
>>>>>>> 689eb11fb5dbc931eb8b6b4a5c5efa65bad315c1
<<<<<<< HEAD
GO:0006996
organelle organization
1
0.116
0.0168
7.73e-11
739
2980
1.86
L10
=======
GO:0036230
granulocyte activation
0.0405
1.11
0.116
5.47e-10
5.47e-10
49
384
3.19
>>>>>>> 689eb11fb5dbc931eb8b6b4a5c5efa65bad315c1
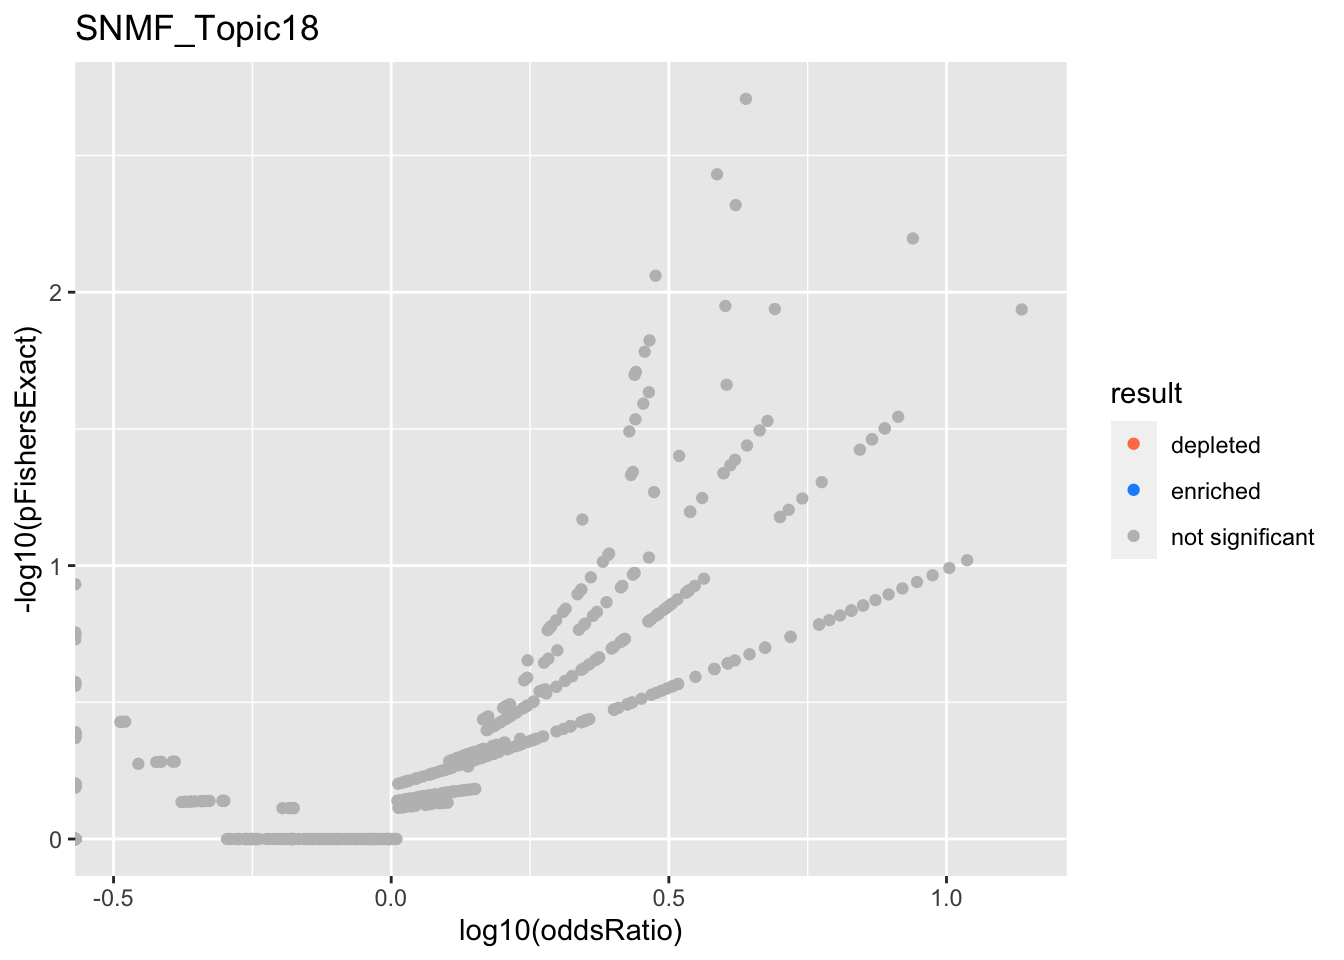
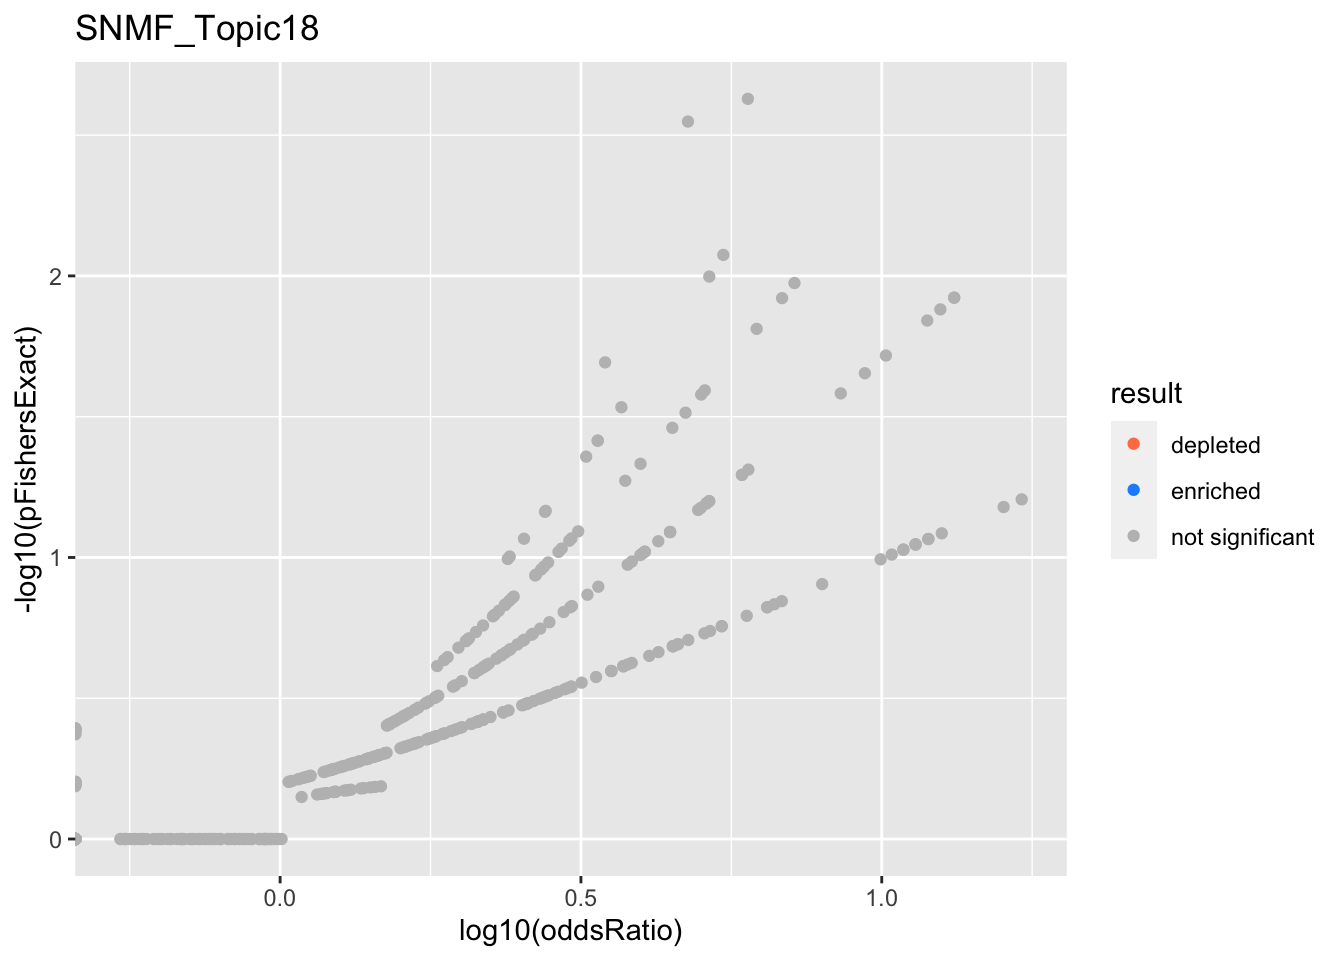
SNMF_Topic18
Past versions of snmf.results-17.png
<<<<<<< HEAD
GO:0022613
ribonucleoprotein complex biogenesis
0.99
0.104
0.0184
6.02e-22
163
391
3.64
L2
=======
Version
Author
Date
>>>>>>> 689eb11fb5dbc931eb8b6b4a5c5efa65bad315c1
<<<<<<< HEAD
GO:0006614
SRP-dependent cotranslational protein targeting to membrane
0.751
0.199
0.0197
2e-32
72
92
17.9
=======
a102c2d
karltayeb
2022-04-13
>>>>>>> 689eb11fb5dbc931eb8b6b4a5c5efa65bad315c1
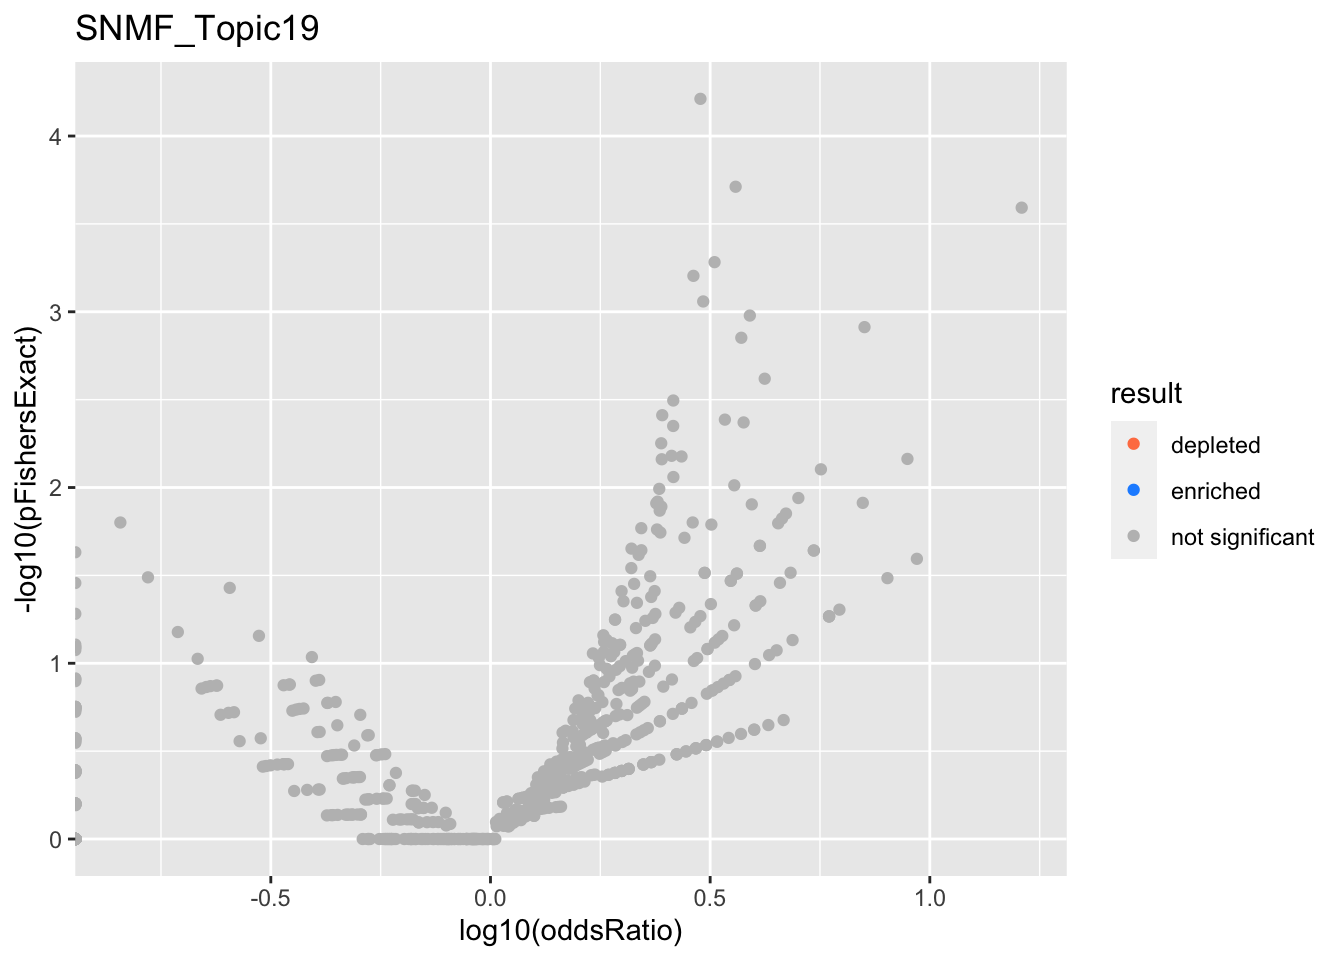
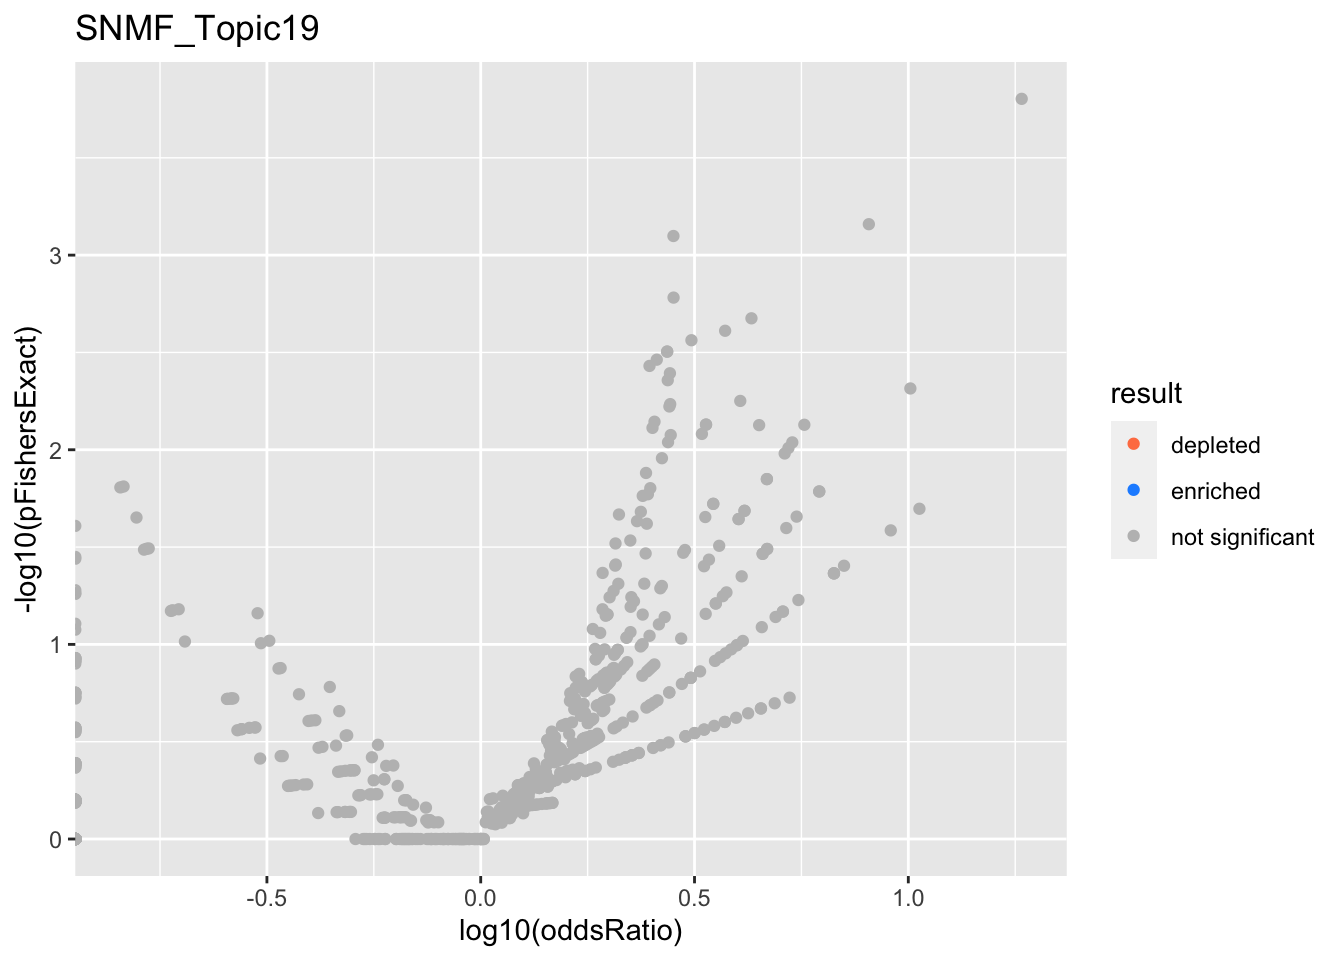
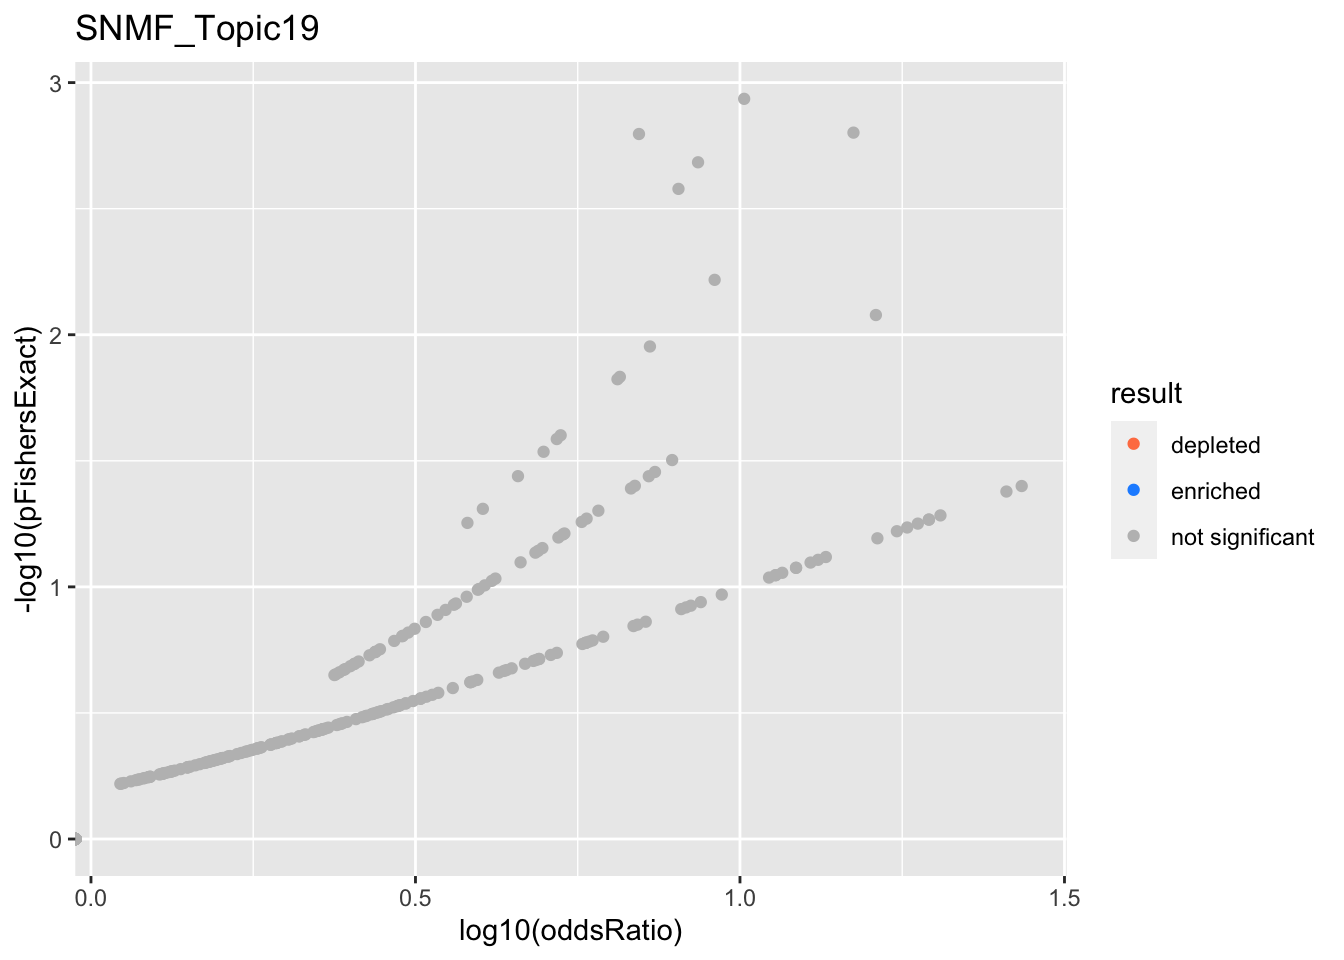
SNMF_Topic19
Past versions of snmf.results-18.png
<<<<<<< HEAD
GO:0006613
cotranslational protein targeting to membrane
0.242
0.196
0.0197
2.13e-31
73
96
15.8
L3
=======
Version
Author
Date
a102c2d
karltayeb
2022-04-13
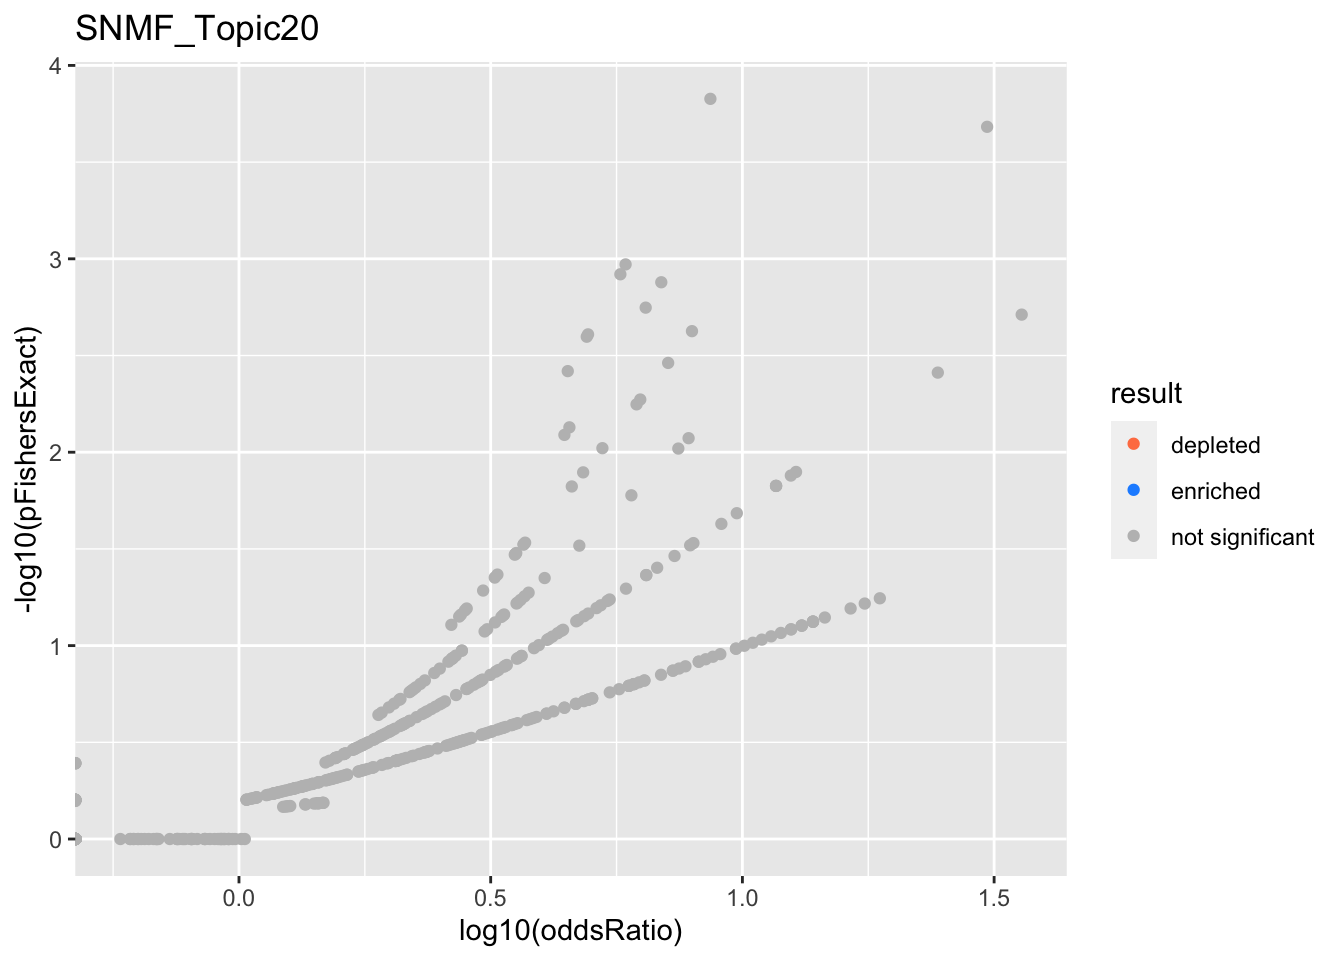
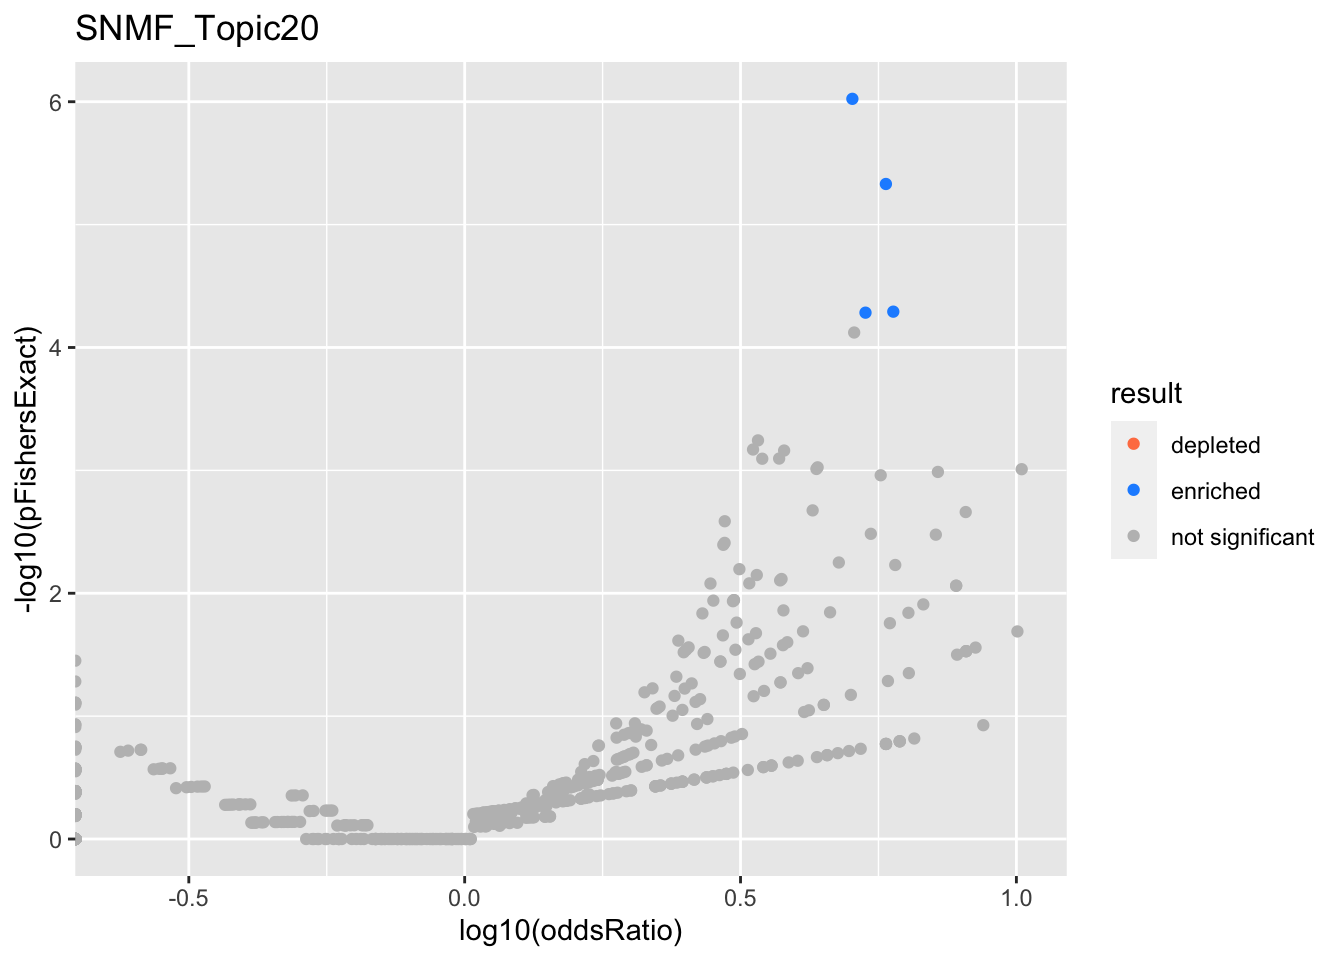
SNMF_Topic20
Past versions of snmf.results-19.png
Version
Author
Date
>>>>>>> 689eb11fb5dbc931eb8b6b4a5c5efa65bad315c1
<<<<<<< HEAD
GO:0043269
regulation of ion transport
0.964
-0.115
0.0204
1
59
481
0.669
L4
=======
a102c2d
karltayeb
2022-04-13
SNMF - Positive loadings
res <- positive.fits %>%
  filter(str_detect(experiment, '^SNMF*')) %>%
  get_plot_tbl(., positive.ora)

html_tables <- positive.fits %>%
  filter(str_detect(experiment, '^SNMF*')) %>%
  get_table_tbl(., positive.ora)

experiments <- unique(res$experiment)
for (i in 1:length(experiments)){
  this_experiment <- experiments[i]
  cat("\n")
  cat("###", this_experiment, "\n") # Create second level headings with the names.

  # print volcano plot
  p <- do.volcano(res %>% filter(experiment == this_experiment)) +
    labs(title=this_experiment)
  print(p)

  cat("\n\n")

  # print table
  for(db in names(html_tables[[this_experiment]])){
    cat("####", db, "\n") # Create second level headings with the names.
    to_print <- html_tables[[this_experiment]][[db]] %>% distinct()
    to_print %>% report_susie_credible_sets() %>% htmltools::HTML() %>% print()
    cat("\n")
  }}
SNMF_Topic2
Past versions of positive.snmf.results-1.png
Version
Author
Date
a102c2d
karltayeb
2022-04-13
gobp_nr
geneSet
description
alpha
beta
beta.se
pHypergeometric
pFishersExact
overlap
geneSetSize
oddsRatio
L1
>>>>>>> 689eb11fb5dbc931eb8b6b4a5c5efa65bad315c1
<<<<<<< HEAD
GO:0010467
gene expression
=======
GO:0022613
ribonucleoprotein complex biogenesis
>>>>>>> 689eb11fb5dbc931eb8b6b4a5c5efa65bad315c1
1
<<<<<<< HEAD
0.195
0.0159
2.52e-27
1020
3830
2.29
L6
=======
-1.15
0.117
1
7.26e-20
48
391
0.432
L2
>>>>>>> 689eb11fb5dbc931eb8b6b4a5c5efa65bad315c1
<<<<<<< HEAD
GO:0070646
protein modification by small protein removal
=======
GO:0140053
mitochondrial gene expression
>>>>>>> 689eb11fb5dbc931eb8b6b4a5c5efa65bad315c1
0.739
<<<<<<< HEAD
0.124
0.0184
7.25e-12
98
249
3.23
=======
-1.66
0.206
1
2.62e-12
10
139
0.241
L3
>>>>>>> 689eb11fb5dbc931eb8b6b4a5c5efa65bad315c1
<<<<<<< HEAD
GO:0016579
protein deubiquitination
0.255
0.121
0.0184
2.59e-11
92
233
3.25
L7
=======
GO:0009123
nucleoside monophosphate metabolic process
0.906
-0.781
0.136
1
1.27e-07
44
255
0.651
>>>>>>> 689eb11fb5dbc931eb8b6b4a5c5efa65bad315c1
<<<<<<< HEAD
GO:0045165
cell fate commitment
0.999
-0.121
0.021
=======
GO:0009141
nucleoside triphosphate metabolic process
0.0892
-0.734
0.138
>>>>>>> 689eb11fb5dbc931eb8b6b4a5c5efa65bad315c1
1
<<<<<<< HEAD
22
201
0.591
L9
GO:0006119
oxidative phosphorylation
0.94
0.102
0.0183
4.07e-08
41
88
4.28
GO:0042773
ATP synthesis coupled electron transport
0.0287
0.0893
0.0183
2.17e-06
31
67
4.21
gomf
geneSet
description
alpha
beta
beta.se
pValueHypergeometric
overlap
geneSetSize
oddsRatio
L1
GO:0003735
structural constituent of ribosome
1
0.165
0.0185
6.67e-26
91
152
7.39
L3
GO:0003676
nucleic acid binding
1
0.239
0.0167
2.38e-33
813
2790
2.46
kegg
geneSet
description
alpha
beta
beta.se
pValueHypergeometric
overlap
geneSetSize
oddsRatio
L1
hsa03010
Ribosome
1
0.329
0.0274
1.2e-29
85
129
10.1
L3
hsa03050
Proteasome
1
0.182
0.0273
5.25e-10
28
44
8.75
L5
hsa05016
Huntington disease
0.974
0.18
0.0269
2.4e-09
61
146
3.65
topic_11
gobp
geneSet
description
alpha
beta
beta.se
pValueHypergeometric
overlap
geneSetSize
oddsRatio
L2
GO:0048584
positive regulation of response to stimulus
0.998
-0.148
0.0213
0.999
103
1710
0.806
L3
GO:0051234
establishment of localization
0.724
0.21
0.0178
3.46e-10
389
3910
1.75
GO:0006810
transport
0.276
0.21
0.0178
5.7e-10
381
3830
1.74
L5
GO:0034976
response to endoplasmic reticulum stress
1
0.159
0.0197
1.72e-11
51
239
3.65
L6
GO:0006487
protein N-linked glycosylation
0.988
0.115
0.019
4.9e-09
22
69
6.17
L7
GO:0006665
sphingolipid metabolic process
0.93
0.138
0.0193
9.57e-10
30
112
4.85
GO:0006643
membrane lipid metabolic process
0.0698
0.136
0.02
3.18e-09
36
159
3.9
gomf
geneSet
description
alpha
beta
beta.se
pValueHypergeometric
overlap
geneSetSize
oddsRatio
L1
GO:0004576
oligosaccharyl transferase activity
0.946
0.228
0.0303
6.42e-12
10
10
Inf
GO:0004579
dolichyl-diphosphooligosaccharide-protein glycotransferase activity
0.0542
0.216
0.0304
8.49e-11
9
9
Inf
L4
GO:0003756
protein disulfide isomerase activity
0.491
0.0956
0.0185
2.22e-06
8
14
17.6
GO:0016864
intramolecular oxidoreductase activity, transposing S-S bonds
0.491
0.0956
0.0185
2.22e-06
8
14
17.6
L5
GO:0022857
transmembrane transporter activity
0.993
0.172
0.0201
1.75e-09
106
779
2.21
kegg
geneSet
description
alpha
beta
beta.se
pValueHypergeometric
overlap
geneSetSize
oddsRatio
L2
hsa04141
Protein processing in endoplasmic reticulum
1
0.246
0.0281
1.13e-14
46
149
5.39
L3
hsa04912
GnRH signaling pathway
1
-0.242
0.0395
1
1
83
0.134
L4
hsa04142
Lysosome
1
0.25
0.0276
1.7e-12
37
116
5.57
L5
hsa00510
N-Glycan biosynthesis
1
0.176
0.0275
5.7e-11
21
46
9.73
L6
hsa00564
Glycerophospholipid metabolism
1
0.167
0.0287
5.88e-05
19
80
3.57
topic_8
gobp
geneSet
description
alpha
beta
beta.se
pValueHypergeometric
overlap
geneSetSize
oddsRatio
L2
GO:0006614
SRP-dependent cotranslational protein targeting to membrane
0.965
0.252
0.0194
3.07e-50
67
92
31.7
L4
GO:0022613
ribonucleoprotein complex biogenesis
1
0.161
0.0197
1.03e-21
98
391
3.99
L5
GO:0044271
cellular nitrogen compound biosynthetic process
1
0.232
0.0178
1.16e-24
461
3470
2.26
L7
GO:0042743
hydrogen peroxide metabolic process
0.951
0.1
0.0187
7.66e-06
13
36
6.34
L8
GO:1990823
response to leukemia inhibitory factor
0.5
0.12
0.019
8.65e-09
27
89
4.94
GO:1990830
cellular response to leukemia inhibitory factor
0.5
0.12
0.019
8.65e-09
27
89
4.94
gomf
geneSet
description
alpha
beta
beta.se
pValueHypergeometric
overlap
geneSetSize
oddsRatio
L1
GO:0003735
structural constituent of ribosome
1
0.239
0.0185
9.03e-46
82
152
13.9
L4
GO:0003723
RNA binding
1
0.214
0.0193
3.98e-28
244
1370
2.82
L6
GO:0001054
RNA polymerase I activity
0.975
0.101
0.0195
1.51e-06
7
9
38.8
L7
GO:0016209
antioxidant activity
0.988
0.113
0.0188
1.51e-06
18
57
5.16
kegg
geneSet
description
alpha
beta
beta.se
pValueHypergeometric
overlap
geneSetSize
oddsRatio
L1
hsa03010
Ribosome
1
0.417
0.0272
1.25e-44
78
129
16.6
L3
hsa04664
Fc epsilon RI signaling pathway
1
-0.389
0.0472
1
0
58
0
L4
hsa03013
RNA transport
1
0.182
0.0282
1.77e-06
34
139
3.19
topic_14
gobp
geneSet
description
alpha
beta
beta.se
pValueHypergeometric
overlap
geneSetSize
oddsRatio
L3
GO:0016192
vesicle-mediated transport
1
0.202
0.02
8.07e-10
165
1550
1.95
L4
GO:0045047
protein targeting to ER
0.674
0.154
0.0192
4.98e-10
27
102
5.45
GO:0072599
establishment of protein localization to endoplasmic reticulum
0.18
0.151
0.0193
1.27e-09
27
106
5.18
GO:0070972
protein localization to endoplasmic reticulum
0.105
0.153
0.0197
1.21e-10
32
131
4.92
gomf
geneSet
description
alpha
beta
beta.se
pValueHypergeometric
overlap
geneSetSize
oddsRatio
L2
GO:0004888
transmembrane signaling receptor activity
0.984
-0.144
0.0239
1
17
527
0.488
L3
GO:0005515
protein binding
1
0.16
0.0115
1.4e-05
626
8650
1.87
kegg
geneSet
description
alpha
beta
beta.se
pValueHypergeometric
overlap
geneSetSize
oddsRatio
L1
hsa05012
Parkinson disease
0.998
0.19
0.0283
1.49e-07
26
106
4.24
L10
hsa03060
Protein export
0.984
0.126
0.0273
1.58e-06
10
21
11.6
L2
hsa04141
Protein processing in endoplasmic reticulum
1
0.183
0.0288
4.49e-08
33
149
3.76
L3
hsa05100
Bacterial invasion of epithelial cells
1
0.165
0.0281
5.55e-06
17
63
4.75
topic_6
gobp
geneSet
description
alpha
beta
beta.se
pValueHypergeometric
overlap
geneSetSize
oddsRatio
L1
GO:0044237
cellular metabolic process
0.295
-0.102
0.0122
1
917
7710
1.13
GO:0008152
metabolic process
0.241
-0.0954
0.0115
1
981
8190
1.17
GO:0006807
nitrogen compound metabolic process
0.197
-0.107
0.0129
1
857
7250
1.1
GO:0044238
primary metabolic process
0.136
-0.102
0.0124
1
903
7580
1.13
GO:0071704
organic substance metabolic process
0.131
-0.099
0.012
1
939
7850
1.16
gomf
geneSet
description
alpha
beta
beta.se
pValueHypergeometric
overlap
geneSetSize
oddsRatio
L1
GO:0016740
transferase activity
0.999
-0.115
0.0195
1
191
1920
0.843
kegg
geneSet
description
alpha
beta
beta.se
pValueHypergeometric
overlap
geneSetSize
oddsRatio
L4
hsa03050
Proteasome
1
0.15
0.027
1.71e-07
20
44
6.43
topic_12
gobp
geneSet
description
alpha
beta
beta.se
pValueHypergeometric
overlap
geneSetSize
oddsRatio
L2
GO:0006614
SRP-dependent cotranslational protein targeting to membrane
0.92
0.288
0.0185
1.58e-48
49
92
39.1
GO:0006613
cotranslational protein targeting to membrane
0.0572
0.287
0.0187
2.62e-47
49
96
35.8
L4
GO:0090304
nucleic acid metabolic process
1
0.376
0.0196
1.62e-22
212
3640
2.91
gomf
geneSet
description
alpha
beta
beta.se
pValueHypergeometric
overlap
geneSetSize
oddsRatio
L1
GO:0003735
structural constituent of ribosome
1
0.213
0.0189
7.82e-39
52
152
17.7
L4
GO:0003723
RNA binding
1
0.45
0.0204
2.42e-49
158
1370
5.83
L5
GO:0038023
signaling receptor activity
0.985
-0.26
0.0279
1
5
697
0.204
kegg
geneSet
description
alpha
beta
beta.se
pValueHypergeometric
overlap
geneSetSize
oddsRatio
L1
hsa03010
Ribosome
1
0.459
0.0272
3.43e-39
51
129
21
topic_13
gobp
geneSet
description
alpha
beta
beta.se
pValueHypergeometric
overlap
geneSetSize
oddsRatio
L3
GO:0045047
protein targeting to ER
0.84
0.222
0.0191
2.89e-18
29
102
11.4
GO:0072599
establishment of protein localization to endoplasmic reticulum
0.149
0.221
0.0192
9.23e-18
29
106
10.8
L4
GO:0009994
oocyte differentiation
0.982
0.126
0.0194
1.44e-06
10
40
9.14
gomf
geneSet
description
alpha
beta
beta.se
pValueHypergeometric
overlap
geneSetSize
oddsRatio
L2
GO:0003735
structural constituent of ribosome
1
0.218
0.0197
6.33e-15
31
152
7.29
kegg
geneSet
description
alpha
beta
beta.se
pValueHypergeometric
overlap
geneSetSize
oddsRatio
L1
hsa03010
Ribosome
1
0.316
0.0283
2.27e-16
32
129
8.53
L2
hsa04660
T cell receptor signaling pathway
1
-0.334
0.046
1
0
88
0
topic_20
gobp
geneSet
description
alpha
beta
beta.se
pValueHypergeometric
overlap
geneSetSize
oddsRatio
L3
GO:0071704
organic substance metabolic process
0.998
0.267
0.0142
2.13e-07
268
7850
2.12
L4
GO:0072594
establishment of protein localization to organelle
1
0.255
0.0214
5.01e-13
45
462
4.17
gomf
geneSet
description
alpha
beta
beta.se
pValueHypergeometric
overlap
geneSetSize
oddsRatio
L2
GO:0060089
molecular transducer activity
0.99
-0.299
0.0281
1
5
751
0.221
L3
GO:0003723
RNA binding
1
0.377
0.0212
4.05e-20
101
1370
3.53
kegg
geneSet
description
alpha
beta
beta.se
pValueHypergeometric
overlap
geneSetSize
oddsRatio
L1
hsa04926
Relaxin signaling pathway
1
-0.415
0.0467
1
0
114
0
topic_18
gobp
geneSet
description
alpha
beta
beta.se
pValueHypergeometric
overlap
geneSetSize
oddsRatio
L2
GO:0006614
SRP-dependent cotranslational protein targeting to membrane
0.907
0.259
0.0188
2.17e-58
57
92
49.3
GO:0006613
cotranslational protein targeting to membrane
0.081
0.258
0.0189
7.66e-57
57
96
44.2
L4
GO:0042773
ATP synthesis coupled electron transport
0.496
0.213
0.0189
1.28e-16
23
67
14.5
GO:0042775
mitochondrial ATP synthesis coupled electron transport
0.496
0.213
0.0189
1.28e-16
23
67
14.5
L5
GO:0006518
peptide metabolic process
1
0.308
0.0207
1.03e-44
113
666
6.91
L6
GO:0006278
RNA-dependent DNA biosynthetic process
0.84
0.154
0.0199
1.05e-07
14
65
7.46
GO:0007004
telomere maintenance via telomerase
0.117
0.148
0.0198
5.1e-07
13
63
7.05
gomf
geneSet
description
alpha
beta
beta.se
pValueHypergeometric
overlap
geneSetSize
oddsRatio
L1
GO:0003735
structural constituent of ribosome
1
0.264
0.0187
2.37e-55
67
152
24.4
L3
GO:0003723
RNA binding
1
0.468
0.0203
9.01e-57
179
1370
6.04
L4
GO:0003954
NADH dehydrogenase activity
0.333
0.174
0.0189
1.75e-11
14
36
17.4
GO:0008137
NADH dehydrogenase (ubiquinone) activity
0.333
0.174
0.0189
1.75e-11
14
36
17.4
GO:0050136
NADH dehydrogenase (quinone) activity
0.333
0.174
0.0189
1.75e-11
14
36
17.4
L5
GO:0015318
inorganic molecular entity transmembrane transporter activity
0.983
-0.197
0.027
0.997
12
612
0.516
L6
GO:0004298
threonine-type endopeptidase activity
0.5
0.158
0.0187
4.97e-11
11
21
29.8
GO:0070003
threonine-type peptidase activity
0.5
0.158
0.0187
4.97e-11
11
21
29.8
L7
GO:0004129
cytochrome-c oxidase activity
0.297
0.171
0.0191
7.82e-07
8
22
15.4
GO:0015002
heme-copper terminal oxidase activity
0.297
0.171
0.0191
7.82e-07
8
22
15.4
GO:0016676
oxidoreductase activity, acting on a heme group of donors, oxygen as acceptor
0.297
0.171
0.0191
7.82e-07
8
22
15.4
GO:0016675
oxidoreductase activity, acting on a heme group of donors
0.109
0.17
0.0193
1.16e-06
8
23
14.4
L8
GO:0051082
unfolded protein binding
1
0.167
0.0203
4.16e-09
19
99
6.52
L9
GO:0016679
oxidoreductase activity, acting on diphenols and related substances as donors
0.332
0.0968
0.0187
6.43e-05
4
7
35.6
GO:0008121
ubiquinol-cytochrome-c reductase activity
0.332
0.0968
0.0187
6.43e-05
4
7
35.6
GO:0016681
oxidoreductase activity, acting on diphenols and related substances as donors, cytochrome as acceptor
0.332
0.0968
0.0187
6.43e-05
4
7
35.6
kegg
geneSet
description
alpha
beta
beta.se
pValueHypergeometric
overlap
geneSetSize
oddsRatio
L1
hsa03010
Ribosome
1
0.504
0.027
2.79e-48
65
129
22.4
L3
hsa03050
Proteasome
1
0.26
0.0274
6.37e-12
18
44
12.9
L4
hsa05016
Huntington disease
1
0.202
0.0287
2.37e-15
37
146
6.65
L5
hsa05012
Parkinson disease
1
0.206
0.028
1.07e-16
33
106
8.79
topic_9
gobp
geneSet
description
alpha
beta
beta.se
pValueHypergeometric
overlap
geneSetSize
oddsRatio
L2
GO:0006955
immune response
1
0.392
0.0202
7.37e-41
158
1330
4.72
L3
GO:0008152
metabolic process
0.999
-0.223
0.0137
1
283
8190
0.775
L4
GO:0046649
lymphocyte activation
1
0.201
0.0202
1.33e-28
80
495
5.76
gomf
geneSet
description
alpha
beta
beta.se
pValueHypergeometric
overlap
geneSetSize
oddsRatio
L3
GO:0038023
signaling receptor activity
0.996
0.267
0.0209
9.29e-15
73
697
3.32
L4
GO:0050662
coenzyme binding
1
-0.17
0.0274
0.999
2
239
0.21
kegg
geneSet
description
alpha
beta
beta.se
pValueHypergeometric
overlap
geneSetSize
oddsRatio
L1
hsa04640
Hematopoietic cell lineage
1
0.17
0.0289
4.58e-06
12
55
6.4
L2
hsa01100
Metabolic pathways
1
-0.292
0.0343
1
22
1020
0.431
L3
hsa04621
NOD-like receptor signaling pathway
1
0.221
0.0295
2.96e-08
22
125
5.06
topic_19
gobp
[1] “nothing to report…”
gomf
[1] “nothing to report…”
kegg
[1] “nothing to report…”
topic_16
gobp
[1] “nothing to report…”
gomf
[1] “nothing to report…”
kegg
[1] “nothing to report…”
topic_15
gobp
[1] “nothing to report…”
gomf
[1] “nothing to report…”
kegg
[1] “nothing to report…”
SNMF
ix  <- order(snmf$fl$pve[-1], decreasing = T) + 1  # exclude first topic
Y.snmf <- purrr::map(ix, ~get_y(snmf$fl$L.lfsr[,.x], 1e-5))
names(Y.snmf) = paste0('topic_', ix)

snmf.gobp <- xfun::cache_rds({
  susie.args <- list(L=10, maxit=200, verbose=T)
  purrr::map(Y.snmf, ~do_logistic_susie(.x, 'gobp', susie.args = susie.args))},
  dir = 'cache/deng_example/', file='snmf.gobp', rerun=T)

snmf.gomf <- xfun::cache_rds({
  susie.args <- list(L=10, maxit=200, verbose=T)
  purrr::map(Y.snmf, ~do_logistic_susie(.x, 'gomf', susie.args = susie.args))},
  dir = 'cache/deng_example/', file='snmf.gomf')

snmf.kegg <- xfun::cache_rds({
  susie.args <- list(L=10, maxit=200, verbose=T)
  purrr::map(Y.snmf, ~do_logistic_susie(.x, 'kegg', susie.args = susie.args))},
  dir = 'cache/deng_example/', file='snmf.kegg')

snmf.fits <- mget(ls(pattern='^snmf.+'))
names(snmf.fits) <- purrr::map_chr(names(snmf.fits), ~str_split(.x, '\\.')[[1]][2])
for(topic in names(Y.snmf)){
cat("\n")
cat("###", topic, "\n") # Create second level headings with the names.
for(db in names(genesets)){
cat("####", db, "\n") # Create second level headings with the names.
possibly_make_susie_html_table(snmf.fits, db, topic) %>% print()
cat("\n")
}
}
topic_2
gobp
geneSet
description
alpha
beta
beta.se
pValueHypergeometric
overlap
geneSetSize
oddsRatio
L1
GO:0006614
SRP-dependent cotranslational protein targeting to membrane
0.5
0.181
0.0203
1.52e-19
79
92
15.3
GO:0045047
protein targeting to ER
0.247
0.178
0.0202
3.53e-19
85
102
12.6
GO:0006613
cotranslational protein targeting to membrane
0.164
0.178
0.0203
5.19e-19
81
96
13.6
GO:0072599
establishment of protein localization to endoplasmic reticulum
0.0877
0.175
0.0201
9.61e-19
87
106
11.6
L3
GO:0042773
ATP synthesis coupled electron transport
0.43
0.0915
0.0186
7.01e-07
47
67
5.88
GO:0042775
mitochondrial ATP synthesis coupled electron transport
0.43
0.0915
0.0186
7.01e-07
47
67
5.88
GO:0006119
oxidative phosphorylation
0.0721
0.0841
0.0185
2.89e-06
57
88
4.6
GO:0022904
respiratory electron transport chain
0.0115
0.0763
0.0185
3.12e-05
52
83
4.2
GO:0045333
cellular respiration
0.0102
0.0751
0.0183
2.57e-05
83
145
3.36
gomf
geneSet
description
alpha
beta
beta.se
pValueHypergeometric
overlap
geneSetSize
oddsRatio
L1
GO:0003735
structural constituent of ribosome
1
0.2
0.0196
3.39e-23
121
152
9.88
kegg
geneSet
description
alpha
beta
beta.se
pValueHypergeometric
overlap
geneSetSize
oddsRatio
L1
hsa03010
Ribosome
1
0.315
0.0296
1.03e-23
108
129
13.1
L2
hsa05012
Parkinson disease
0.936
0.165
0.0274
5.98e-09
73
106
5.51
hsa05016
Huntington disease
0.0373
0.148
0.0271
1.55e-07
91
146
4.14
L4
hsa03050
Proteasome
0.998
0.144
0.0283
1.14e-06
34
44
8.36
topic_3
gobp
geneSet
description
alpha
beta
beta.se
pValueHypergeometric
overlap
geneSetSize
oddsRatio
L2
GO:0006613
cotranslational protein targeting to membrane
0.794
0.206
0.0196
9.16e-39
74
96
20.7
GO:0006614
SRP-dependent cotranslational protein targeting to membrane
0.206
0.204
0.0196
1.53e-38
72
92
22.2
L3
GO:0042773
ATP synthesis coupled electron transport
0.499
0.196
0.0191
3.66e-23
48
67
15.4
GO:0042775
mitochondrial ATP synthesis coupled electron transport
0.499
0.196
0.0191
3.66e-23
48
67
15.4
L5
GO:0070646
protein modification by small protein removal
0.838
0.127
0.0186
7.39e-13
88
249
3.35
GO:0016579
protein deubiquitination
0.162
0.123
0.0186
5.82e-12
82
233
3.33
L6
GO:0006412
translation
0.903
0.171
0.0188
2.82e-30
195
527
3.77
GO:0043043
peptide biosynthetic process
0.0812
0.166
0.0188
1.47e-28
196
545
3.6
L8
GO:0051276
chromosome organization
1
0.142
0.0186
8.88e-12
233
924
2.14
gomf
geneSet
description
alpha
beta
beta.se
pValueHypergeometric
overlap
geneSetSize
oddsRatio
L1
GO:0003735
structural constituent of ribosome
1
0.214
0.0188
1.65e-41
100
152
11.9
L10
GO:0004298
threonine-type endopeptidase activity
0.495
0.0958
0.0187
5.38e-07
14
21
11.9
GO:0070003
threonine-type peptidase activity
0.495
0.0958
0.0187
5.38e-07
14
21
11.9
L2
GO:0004888
transmembrane signaling receptor activity
1
-0.194
0.0222
1
34
527
0.397
L3
GO:0003954
NADH dehydrogenase activity
0.333
0.18
0.0203
4.05e-18
30
36
30
GO:0008137
NADH dehydrogenase (ubiquinone) activity
0.333
0.18
0.0203
4.05e-18
30
36
30
GO:0050136
NADH dehydrogenase (quinone) activity
0.333
0.18
0.0203
4.05e-18
30
36
30
L5
GO:0003723
RNA binding
1
0.179
0.0182
2.85e-31
392
1370
2.72
L6
GO:0031625
ubiquitin protein ligase binding
0.779
0.0988
0.0188
1.26e-07
77
257
2.59
GO:0044389
ubiquitin-like protein ligase binding
0.206
0.094
0.0189
6.36e-07
78
271
2.44
L8
GO:0016679
oxidoreductase activity, acting on diphenols and related substances as donors
0.333
0.152
0.0281
3.95e-06
7
7
Inf
GO:0008121
ubiquinol-cytochrome-c reductase activity
0.333
0.152
0.0281
3.95e-06
7
7
Inf
GO:0016681
oxidoreductase activity, acting on diphenols and related substances as donors, cytochrome as acceptor
0.333
0.152
0.0281
3.95e-06
7
7
Inf
L9
GO:0045296
cadherin binding
0.978
0.104
0.0187
7.64e-10
89
282
2.81
kegg
geneSet
description
alpha
beta
beta.se
pValueHypergeometric
overlap
geneSetSize
oddsRatio
L1
hsa03010
Ribosome
1
0.397
0.0279
5.06e-39
92
129
14.2
L2
hsa05012
Parkinson disease
1
0.331
0.0277
1.67e-28
72
106
11.9
L3
hsa04110
Cell cycle
0.997
0.149
0.0271
1.5e-05
42
118
2.98
L4
hsa03050
Proteasome
1
0.191
0.0273
6.79e-10
27
44
8.52
topic_9
gobp
geneSet
description
alpha
beta
beta.se
pValueHypergeometric
overlap
geneSetSize
oddsRatio
L4
GO:0006996
organelle organization
1
0.171
0.0166
2.85e-12
799
2980
1.94
L5
GO:0030154
cell differentiation
0.912
-0.105
0.017
1
587
3040
1.1
GO:0048869
cellular developmental process
0.0703
-0.097
0.0169
1
633
3180
1.15
L6
GO:0099537
trans-synaptic signaling
0.297
-0.125
0.0202
1
69
521
0.678
GO:0099536
synaptic signaling
0.248
-0.124
0.0202
1
70
526
0.682
GO:0007268
chemical synaptic transmission
0.228
-0.124
0.0202
1
68
514
0.677
GO:0098916
anterograde trans-synaptic signaling
0.228
-0.124
0.0202
1
68
514
0.677
L7
GO:0044281
small molecule metabolic process
1
0.156
0.0178
3.03e-12
449
1540
2.04
L8
GO:0006401
RNA catabolic process
0.737
0.111
0.0184
1.44e-08
110
304
2.62
GO:0006402
mRNA catabolic process
0.17
0.106
0.0184
5.48e-08
101
279
2.62
GO:0000184
nuclear-transcribed mRNA catabolic process, nonsense-mediated decay
0.0536
0.102
0.0185
3.35e-08
52
115
3.77
L9
GO:1990823
response to leukemia inhibitory factor
0.481
0.0885
0.0182
5.04e-07
41
89
3.89
GO:1990830
cellular response to leukemia inhibitory factor
0.481
0.0885
0.0182
5.04e-07
41
89
3.89
gomf
geneSet
description
alpha
beta
beta.se
pValueHypergeometric
overlap
geneSetSize
oddsRatio
L1
GO:0004888
transmembrane signaling receptor activity
0.675
-0.118
0.0202
1
66
527
0.633
GO:0038023
signaling receptor activity
0.313
-0.113
0.0198
1
97
697
0.715
L2
GO:0022836
gated channel activity
0.437
-0.115
0.0211
1
23
244
0.462
GO:0022839
ion gated channel activity
0.396
-0.115
0.0211
1
22
237
0.455
GO:0005216
ion channel activity
0.0914
-0.107
0.0207
1
32
295
0.54
GO:0022838
substrate-specific channel activity
0.0302
-0.103
0.0207
1
35
304
0.578
L4
GO:0003723
RNA binding
0.985
0.104
0.0178
1e-08
388
1370
1.92
kegg
geneSet
description
alpha
beta
beta.se
pValueHypergeometric
overlap
geneSetSize
oddsRatio
L4
hsa04080
Neuroactive ligand-receptor interaction
1
-0.231
0.0323
1
12
163
0.321
topic_10
gobp
geneSet
description
alpha
beta
beta.se
pValueHypergeometric
overlap
geneSetSize
oddsRatio
L1
GO:0043299
leukocyte degranulation
0.187
0.101
0.0188
4.82e-08
110
406
2.3
GO:0002446
neutrophil mediated immunity
0.175
0.101
0.0188
7.84e-08
105
386
2.31
GO:0002444
myeloid leukocyte mediated immunity
0.162
0.101
0.0188
7.17e-08
113
423
2.26
GO:0042119
neutrophil activation
0.11
0.0996
0.0188
1.46e-07
103
381
2.29
GO:0043312
neutrophil degranulation
0.0916
0.099
0.0188
2.04e-07
101
374
2.29
GO:0002275
myeloid cell activation involved in immune response
0.0789
0.0985
0.0188
1.45e-07
110
414
2.24
GO:0036230
granulocyte activation
0.0779
0.0984
0.0188
2.21e-07
103
384
2.27
GO:0002283
neutrophil activation involved in immune response
0.0739
0.0982
0.0188
2.69e-07
101
376
2.27
L3
GO:0006614
SRP-dependent cotranslational protein targeting to membrane
0.569
0.152
0.0184
3.34e-12
44
92
5.61
GO:0006613
cotranslational protein targeting to membrane
0.356
0.152
0.0185
4.59e-12
45
96
5.4
GO:0045047
protein targeting to ER
0.0686
0.149
0.0186
1.44e-11
46
102
5.03
L4
GO:0030029
actin filament-based process
0.987
0.161
0.0185
2.43e-17
183
609
2.74
L5
GO:0048013
ephrin receptor signaling pathway
0.978
0.0947
0.0184
2.73e-10
36
75
5.63
L6
GO:0006396
RNA processing
0.998
-0.133
0.0207
1
80
757
0.697
gomf
geneSet
description
alpha
beta
beta.se
pValueHypergeometric
overlap
geneSetSize
oddsRatio
L1
GO:0038023
signaling receptor activity
0.853
-0.125
0.0206
1
73
697
0.689
GO:0060089
molecular transducer activity
0.0922
-0.117
0.0205
1
84
751
0.744
GO:0004888
transmembrane signaling receptor activity
0.0545
-0.117
0.0208
1
52
527
0.647
L2
GO:0045296
cadherin binding
1
0.175
0.0184
3.57e-19
109
282
3.94
L3
GO:0140098
catalytic activity, acting on RNA
0.998
-0.121
0.0217
1
21
265
0.51
kegg
geneSet
description
alpha
beta
beta.se
pValueHypergeometric
overlap
geneSetSize
oddsRatio
L1
hsa04080
Neuroactive ligand-receptor interaction
1
-0.316
0.0359
1
5
163
0.165
L2
hsa04530
Tight junction
1
0.165
0.027
9.63e-10
58
144
3.76
L3
hsa03010
Ribosome
0.998
0.137
0.027
3.37e-06
46
129
3.05
L4
hsa05100
Bacterial invasion of epithelial cells
0.981
0.128
0.0269
1.53e-07
30
63
4.97
topic_8
gobp
geneSet
description
alpha
beta
beta.se
pValueHypergeometric
overlap
geneSetSize
oddsRatio
L2
GO:0006614
SRP-dependent cotranslational protein targeting to membrane
0.915
0.301
0.0206
4.41e-56
78
92
46.2
GO:0006613
cotranslational protein targeting to membrane
0.0843
0.298
0.0206
9.03e-55
79
96
38.6
L4
GO:0006414
translational elongation
0.909
0.148
0.0187
5.9e-14
48
121
5.32
GO:0070125
mitochondrial translational elongation
0.0517
0.14
0.0186
2.46e-12
37
86
6.07
L5
GO:0022613
ribonucleoprotein complex biogenesis
1
0.169
0.0192
9.1e-25
126
391
4
L6
GO:0022900
electron transport chain
1
0.145
0.0187
5.98e-11
49
147
4.04
L7
GO:2000145
regulation of cell motility
0.597
-0.126
0.0216
1
47
686
0.565
GO:0030334
regulation of cell migration
0.344
-0.124
0.0217
1
44
644
0.564
GO:0051270
regulation of cellular component movement
0.0298
-0.113
0.0215
1
58
749
0.647
L9
GO:0072655
establishment of protein localization to mitochondrion
0.453
0.117
0.0189
3.83e-08
37
115
3.8
GO:0070585
protein localization to mitochondrion
0.277
0.115
0.0189
6.36e-08
37
117
3.71
GO:0006626
protein targeting to mitochondrion
0.268
0.114
0.0188
2.5e-08
31
86
4.51
gomf
geneSet
description
alpha
beta
beta.se
pValueHypergeometric
overlap
geneSetSize
oddsRatio
L1
GO:0003735
structural constituent of ribosome
1
0.274
0.019
2.09e-60
106
152
19.5
L2
GO:0004888
transmembrane signaling receptor activity
1
-0.219
0.0235
1
22
527
0.333
L5
GO:0003723
RNA binding
1
0.189
0.0187
1.27e-32
322
1370
2.83
L7
GO:0003954
NADH dehydrogenase activity
0.325
0.106
0.0184
6.24e-08
18
36
7.96
GO:0008137
NADH dehydrogenase (ubiquinone) activity
0.325
0.106
0.0184
6.24e-08
18
36
7.96
GO:0050136
NADH dehydrogenase (quinone) activity
0.325
0.106
0.0184
6.24e-08
18
36
7.96
kegg
geneSet
description
alpha
beta
beta.se
pValueHypergeometric
overlap
geneSetSize
oddsRatio
L1
hsa03010
Ribosome
1
0.467
0.0284
3.24e-55
98
129
23.5
L4
hsa00190
Oxidative phosphorylation
0.992
0.208
0.0271
9.62e-11
41
97
5.01
L5
hsa04060
Cytokine-cytokine receptor interaction
1
-0.309
0.037
1
4
173
0.151
L6
hsa03013
RNA transport
0.998
0.14
0.0276
0.000144
38
139
2.54
L7
hsa03050
Proteasome
0.985
0.126
0.0271
0.000128
17
44
4.2
topic_7
gobp
geneSet
description
alpha
beta
beta.se
pValueHypergeometric
overlap
geneSetSize
oddsRatio
L1
GO:0042254
ribosome biogenesis
1
0.216
0.0188
1.92e-56
152
247
10
L10
GO:0070647
protein modification by small protein conjugation or removal
1
0.17
0.0187
5.21e-15
238
876
2.34
L2
GO:0048731
system development
0.954
-0.181
0.0178
1
462
3550
0.836
L3
GO:0006397
mRNA processing
0.998
0.2
0.0184
8.57e-44
193
425
5.28
L4
GO:0006413
translational initiation
1
0.183
0.0189
1.43e-41
110
177
10.1
L5
GO:0006996
organelle organization
1
0.216
0.0173
4.76e-18
665
2980
2.02
L6
GO:0003008
system process
0.968
-0.134
0.0206
1
120
1240
0.606
L7
GO:0034641
cellular nitrogen compound metabolic process
1
0.336
0.0154
2.87e-84
1190
4670
3.48
L8
GO:0035270
endocrine system development
1
-0.23
0.0265
1
2
113
0.104
L9
GO:0006360
transcription by RNA polymerase I
0.999
0.121
0.0195
2.25e-18
38
53
15.1
gomf
geneSet
description
alpha
beta
beta.se
pValueHypergeometric
overlap
geneSetSize
oddsRatio
L1
GO:0003723
RNA binding
1
0.408
0.0176
4.87e-115
570
1370
5.33
L2
GO:0038023
signaling receptor activity
0.998
-0.277
0.0229
1
35
697
0.291
L5
GO:0003954
NADH dehydrogenase activity
0.333
0.122
0.0186
5.56e-09
22
36
9.11
GO:0008137
NADH dehydrogenase (ubiquinone) activity
0.333
0.122
0.0186
5.56e-09
22
36
9.11
GO:0050136
NADH dehydrogenase (quinone) activity
0.333
0.122
0.0186
5.56e-09
22
36
9.11
L6
GO:0003735
structural constituent of ribosome
1
0.123
0.0185
1.61e-29
88
152
8.21
L7
GO:0042393
histone binding
1
0.12
0.0186
2.65e-11
64
163
3.8
L8
GO:0005509
calcium ion binding
1
-0.185
0.0224
1
31
491
0.377
L9
GO:0003677
DNA binding
1
0.138
0.0182
5.15e-14
383
1580
2.04
kegg
geneSet
description
alpha
beta
beta.se
pValueHypergeometric
overlap
geneSetSize
oddsRatio
L1
hsa03010
Ribosome
1
0.35
0.0273
1.19e-28
82
129
9.65
L10
hsa03020
RNA polymerase
0.799
0.124
0.0277
1.09e-07
18
27
10.4
hsa00240
Pyrimidine metabolism
0.165
0.117
0.0285
3.15e-05
33
86
3.27
L3
hsa03040
Spliceosome
1
0.257
0.0271
9.96e-17
64
121
6.09
L4
hsa03013
RNA transport
1
0.213
0.0273
8.44e-15
67
139
5.05
L5
hsa05016
Huntington disease
1
0.244
0.0272
1.16e-14
69
146
4.86
L6
hsa03050
Proteasome
1
0.195
0.0273
1.05e-09
27
44
8.36
L7
hsa03008
Ribosome biogenesis in eukaryotes
1
0.193
0.0274
3.89e-12
39
68
7.15
L8
hsa04110
Cell cycle
1
0.183
0.0271
1.87e-07
47
118
3.52
L9
hsa04080
Neuroactive ligand-receptor interaction
1
-0.536
0.042
1
1
163
0.0308
topic_4
gobp
geneSet
description
alpha
beta
beta.se
pValueHypergeometric
overlap
geneSetSize
oddsRatio
L2
GO:0006614
SRP-dependent cotranslational protein targeting to membrane
0.577
0.151
0.0184
7.93e-16
50
92
7
GO:0045047
protein targeting to ER
0.323
0.15
0.0185
1.38e-15
53
102
6.37
GO:0006613
cotranslational protein targeting to membrane
0.0604
0.146
0.0184
7.78e-15
50
96
6.39
gomf
geneSet
description
alpha
beta
beta.se
pValueHypergeometric
overlap
geneSetSize
oddsRatio
L2
=======
6.37e-07
43
244
0.668
L5
>>>>>>> 689eb11fb5dbc931eb8b6b4a5c5efa65bad315c1
<<<<<<< HEAD
GO:0003735
structural constituent of ribosome
=======
GO:0002446
neutrophil mediated immunity
>>>>>>> 689eb11fb5dbc931eb8b6b4a5c5efa65bad315c1
0.803
<<<<<<< HEAD
0.117
0.0183
3.6e-12
63
152
4.12
L4
=======
-0.57
0.108
1
3.48e-06
82
386
0.844
>>>>>>> 689eb11fb5dbc931eb8b6b4a5c5efa65bad315c1
<<<<<<< HEAD
GO:0003676
nucleic acid binding
1
0.128
0.0171
3.36e-11
608
2790
1.83
kegg
geneSet
description
alpha
beta
beta.se
pValueHypergeometric
overlap
geneSetSize
oddsRatio
L1
hsa03010
Ribosome
=======
GO:0036230
granulocyte activation
0.192
-0.541
0.109
>>>>>>> 689eb11fb5dbc931eb8b6b4a5c5efa65bad315c1
1
0.228
<<<<<<< HEAD
0.0269
8.76e-15
60
129
5.28
L4
hsa05016
Huntington disease
0.999
0.162
0.0271
1.79e-07
51
146
3.21
=======
1.27e-05
84
384
0.876
SNMF_Topic3
Past versions of positive.snmf.results-2.png
Version
Author
Date
a102c2d
karltayeb
2022-04-13
>>>>>>> 689eb11fb5dbc931eb8b6b4a5c5efa65bad315c1
<<<<<<< HEAD
topic_5
gobp
=======
gobp_nr
>>>>>>> 689eb11fb5dbc931eb8b6b4a5c5efa65bad315c1
geneSet
description
alpha
beta
beta.se
<<<<<<< HEAD
pValueHypergeometric
=======
pHypergeometric
pFishersExact
>>>>>>> 689eb11fb5dbc931eb8b6b4a5c5efa65bad315c1
overlap
geneSetSize
oddsRatio
<<<<<<< HEAD
=======
>>>>>>> 689eb11fb5dbc931eb8b6b4a5c5efa65bad315c1
L1
<<<<<<< HEAD
GO:0006613
cotranslational protein targeting to membrane
0.853
0.235
0.0191
4.32e-36
=======
GO:0006413
translational initiation
1
2.14
0.158
4.42e-57
>>>>>>> 689eb11fb5dbc931eb8b6b4a5c5efa65bad315c1
4.42e-57
<<<<<<< HEAD
96
17.7
=======
90
177
16.6
L2
>>>>>>> 689eb11fb5dbc931eb8b6b4a5c5efa65bad315c1
<<<<<<< HEAD
GO:0000184
nuclear-transcribed mRNA catabolic process, nonsense-mediated decay
0.106
0.236
0.0195
1.32e-35
76
115
13.5
L2
=======
GO:0010257
NADH dehydrogenase complex assembly
0.998
2.63
0.306
1.9e-25
1.9e-25
31
46
30.6
L3
>>>>>>> 689eb11fb5dbc931eb8b6b4a5c5efa65bad315c1
<<<<<<< HEAD
GO:0034622
cellular protein-containing complex assembly
0.998
0.137
0.0191
1.02e-07
178
823
1.93
L5
=======
GO:0070972
protein localization to endoplasmic reticulum
1
1.96
0.184
2.42e-51
2.42e-51
74
131
20.3
L4
>>>>>>> 689eb11fb5dbc931eb8b6b4a5c5efa65bad315c1
<<<<<<< HEAD
GO:0006996
organelle organization
=======
GO:0006091
generation of precursor metabolites and energy
>>>>>>> 689eb11fb5dbc931eb8b6b4a5c5efa65bad315c1
1
<<<<<<< HEAD
-0.122
0.0179
0.998
401
2980
1.05
=======
1.43
0.115
2.58e-27
2.58e-27
91
371
5.11
>>>>>>> 689eb11fb5dbc931eb8b6b4a5c5efa65bad315c1
gomf
geneSet
description
alpha
beta
beta.se
pValueHypergeometric
overlap
geneSetSize
oddsRatio
<<<<<<< HEAD
L1
=======
L5
>>>>>>> 689eb11fb5dbc931eb8b6b4a5c5efa65bad315c1
<<<<<<< HEAD
GO:0003735
structural constituent of ribosome
=======
GO:0006414
translational elongation
>>>>>>> 689eb11fb5dbc931eb8b6b4a5c5efa65bad315c1
1
<<<<<<< HEAD
0.227
0.0184
8.29e-32
85
152
8.82
=======
2.08
0.19
5.8e-15
5.8e-15
37
121
6.53
>>>>>>> 689eb11fb5dbc931eb8b6b4a5c5efa65bad315c1
L6
<<<<<<< HEAD
GO:0036402
proteasome-activating ATPase activity
0.955
0.129
0.0261
1.15e-05
6
6
Inf
=======
GO:0070671
response to interleukin-12
1
2.43
0.307
2.64e-11
2.64e-11
19
44
11.1
L7
>>>>>>> 689eb11fb5dbc931eb8b6b4a5c5efa65bad315c1
kegg
<<<<<<< HEAD
geneSet
description
alpha
beta
beta.se
pValueHypergeometric
overlap
geneSetSize
oddsRatio
L1
=======
GO:0002446
neutrophil mediated immunity
0.75
0.987
0.117
1.36e-09
1.53e-09
61
386
2.81
>>>>>>> 689eb11fb5dbc931eb8b6b4a5c5efa65bad315c1
<<<<<<< HEAD
hsa03010
Ribosome
1
0.349
0.0274
2.72e-34
83
129
11.7
L4
=======
GO:0036230
granulocyte activation
0.25
0.975
0.117
2.91e-09
3.11e-09
60
384
2.77
L8
>>>>>>> 689eb11fb5dbc931eb8b6b4a5c5efa65bad315c1
<<<<<<< HEAD
hsa03050
Proteasome
=======
GO:0070585
protein localization to mitochondrion
>>>>>>> 689eb11fb5dbc931eb8b6b4a5c5efa65bad315c1
1
<<<<<<< HEAD
0.166
0.027
1.22e-08
24
44
7.28
L5
=======
1.62
0.198
1.38e-09
1.38e-09
29
117
4.83
L9
>>>>>>> 689eb11fb5dbc931eb8b6b4a5c5efa65bad315c1
<<<<<<< HEAD
hsa04973
Carbohydrate digestion and absorption
=======
GO:0043687
post-translational protein modification
>>>>>>> 689eb11fb5dbc931eb8b6b4a5c5efa65bad315c1
1
<<<<<<< HEAD
-0.258
0.0431
1
0
32
0
=======
1.05
0.13
2.38e-06
2.66e-06
45
310
2.5
SNMF_Topic4
Past versions of positive.snmf.results-3.png
Version
Author
Date
a102c2d
karltayeb
2022-04-13
>>>>>>> 689eb11fb5dbc931eb8b6b4a5c5efa65bad315c1
<<<<<<< HEAD
topic_12
gobp
=======
gobp_nr
>>>>>>> 689eb11fb5dbc931eb8b6b4a5c5efa65bad315c1
geneSet
description
alpha
beta
beta.se
pHypergeometric
pFishersExact
overlap
geneSetSize
oddsRatio
<<<<<<< HEAD
L3
GO:0034641
cellular nitrogen compound metabolic process
1
0.277
0.0173
2.29e-22
421
4670
2.33
L5
=======
L1
>>>>>>> 689eb11fb5dbc931eb8b6b4a5c5efa65bad315c1
<<<<<<< HEAD
GO:0070125
mitochondrial translational elongation
0.863
0.141
0.0187
2.46e-15
30
86
8.81
GO:0070126
mitochondrial translational termination
0.119
0.137
0.0188
2e-14
29
86
8.36
L6
=======
GO:0016072
rRNA metabolic process
1
0.929
0.141
1.58e-11
2.05e-11
71
210
3.43
L2
>>>>>>> 689eb11fb5dbc931eb8b6b4a5c5efa65bad315c1
<<<<<<< HEAD
GO:0034622
cellular protein-containing complex assembly
1
0.208
0.0203
9.39e-17
115
823
2.87
L7
GO:0006405
RNA export from nucleus
0.537
0.136
0.0194
1.46e-13
34
125
6.16
GO:0071426
ribonucleoprotein complex export from nucleus
0.276
0.134
0.0193
6.51e-13
=======
GO:0006413
translational initiation
0.998
0.872
0.154
1.54e-09
2.31e-09
>>>>>>> 689eb11fb5dbc931eb8b6b4a5c5efa65bad315c1
59
<<<<<<< HEAD
117
6.19
=======
177
3.34
>>>>>>> 689eb11fb5dbc931eb8b6b4a5c5efa65bad315c1
SNMF_Topic5
Past versions of positive.snmf.results-4.png
<<<<<<< HEAD
GO:0071166
ribonucleoprotein complex localization
0.183
0.133
0.0193
8.41e-13
32
118
6.12
L8
=======
Version
Author
Date
>>>>>>> 689eb11fb5dbc931eb8b6b4a5c5efa65bad315c1
<<<<<<< HEAD
GO:0032501
multicellular organismal process
1
-0.307
0.0182
1
219
5120
0.584
L9
=======
a102c2d
karltayeb
2022-04-13
gobp_nr
geneSet
description
alpha
beta
beta.se
pHypergeometric
pFishersExact
overlap
geneSetSize
oddsRatio
L1
>>>>>>> 689eb11fb5dbc931eb8b6b4a5c5efa65bad315c1
<<<<<<< HEAD
GO:0044265
cellular macromolecule catabolic process
=======
GO:0006413
translational initiation
>>>>>>> 689eb11fb5dbc931eb8b6b4a5c5efa65bad315c1
0.987
<<<<<<< HEAD
0.191
0.0204
=======
1.38
0.154
1.18e-32
1.18e-32
82
177
8.25
L2
GO:0070972
protein localization to endoplasmic reticulum
>>>>>>> 689eb11fb5dbc931eb8b6b4a5c5efa65bad315c1
9.27e-15
1.33
<<<<<<< HEAD
124
977
2.57
=======
0.178
3.96e-30
3.96e-30
67
131
9.9
SNMF_Topic6
Past versions of positive.snmf.results-5.png
Version
Author
Date
a102c2d
karltayeb
2022-04-13
>>>>>>> 689eb11fb5dbc931eb8b6b4a5c5efa65bad315c1
<<<<<<< HEAD
gomf
=======
gobp_nr
>>>>>>> 689eb11fb5dbc931eb8b6b4a5c5efa65bad315c1
geneSet
description
alpha
beta
beta.se
pHypergeometric
pFishersExact
overlap
geneSetSize
oddsRatio
<<<<<<< HEAD
L1
GO:0003723
RNA binding
1
0.356
0.0194
1.99e-42
218
1370
3.86
L2
=======
L1
>>>>>>> 689eb11fb5dbc931eb8b6b4a5c5efa65bad315c1
<<<<<<< HEAD
GO:0043167
ion binding
=======
GO:0002521
leukocyte differentiation
>>>>>>> 689eb11fb5dbc931eb8b6b4a5c5efa65bad315c1
1
<<<<<<< HEAD
-0.145
0.0187
1
218
4420
0.75
L3
GO:0038023
signaling receptor activity
0.999
-0.331
0.0266
1
9
697
0.198
L4
=======
1.19
0.115
8.42e-22
8.42e-22
64
390
5.32
L2
>>>>>>> 689eb11fb5dbc931eb8b6b4a5c5efa65bad315c1
<<<<<<< HEAD
GO:0003735
structural constituent of ribosome
0.992
0.0992
0.019
5.8e-16
41
152
6.15
L5
GO:0004298
threonine-type endopeptidase activity
0.5
0.117
0.0185
1.14e-08
11
21
17.7
=======
GO:0002250
adaptive immune response
1
1.19
0.137
5.43e-20
5.43e-20
50
263
6.2
SNMF_Topic7
Past versions of positive.snmf.results-6.png
Version
Author
Date
>>>>>>> 689eb11fb5dbc931eb8b6b4a5c5efa65bad315c1
<<<<<<< HEAD
GO:0070003
threonine-type peptidase activity
0.5
0.117
0.0185
1.14e-08
11
21
17.7
L7
=======
a102c2d
karltayeb
2022-04-13
SNMF_Topic8
Past versions of positive.snmf.results-7.png
Version
Author
Date
a102c2d
karltayeb
2022-04-13
gobp_nr
geneSet
description
alpha
beta
beta.se
pHypergeometric
pFishersExact
overlap
geneSetSize
oddsRatio
L1
>>>>>>> 689eb11fb5dbc931eb8b6b4a5c5efa65bad315c1
<<<<<<< HEAD
GO:0051082
unfolded protein binding
=======
GO:0070972
protein localization to endoplasmic reticulum
>>>>>>> 689eb11fb5dbc931eb8b6b4a5c5efa65bad315c1
1
<<<<<<< HEAD
0.137
0.0194
1.38e-09
25
99
5.51
kegg
geneSet
description
alpha
beta
beta.se
pValueHypergeometric
overlap
geneSetSize
oddsRatio
L2
hsa03013
RNA transport
1
0.301
0.0278
3.42e-17
44
139
6.68
L3
=======
1.8
0.183
1.74e-45
1.74e-45
83
131
15.8
L2
>>>>>>> 689eb11fb5dbc931eb8b6b4a5c5efa65bad315c1
<<<<<<< HEAD
hsa03010
Ribosome
=======
GO:0006414
translational elongation
>>>>>>> 689eb11fb5dbc931eb8b6b4a5c5efa65bad315c1
1
<<<<<<< HEAD
0.267
0.0281
5.26e-11
34
129
5.02
L4
=======
1.65
0.185
3.5e-16
3.5e-16
49
121
6.05
L3
>>>>>>> 689eb11fb5dbc931eb8b6b4a5c5efa65bad315c1
<<<<<<< HEAD
hsa05130
Pathogenic Escherichia coli infection
=======
GO:0022613
ribonucleoprotein complex biogenesis
>>>>>>> 689eb11fb5dbc931eb8b6b4a5c5efa65bad315c1
1
<<<<<<< HEAD
0.166
0.028
2.45e-05
13
46
5.3
L5
=======
0.866
0.109
6.33e-24
6.33e-24
118
391
4
L4
>>>>>>> 689eb11fb5dbc931eb8b6b4a5c5efa65bad315c1
<<<<<<< HEAD
hsa03050
Proteasome
1
0.215
0.0273
8.71e-10
18
44
9.44
L6
=======
GO:0010257
NADH dehydrogenase complex assembly
0.983
1.93
0.295
8.01e-09
8.01e-09
21
46
7.32
>>>>>>> 689eb11fb5dbc931eb8b6b4a5c5efa65bad315c1
<<<<<<< HEAD
hsa03040
Spliceosome
1
0.189
0.0289
2.43e-07
27
121
3.96
=======
GO:0033108
mitochondrial respiratory chain complex assembly
0.0174
1.54
0.259
7.55e-08
7.55e-08
24
64
5.24
>>>>>>> 689eb11fb5dbc931eb8b6b4a5c5efa65bad315c1
topic_17
gobp
geneSet
description
alpha
beta
beta.se
pValueHypergeometric
overlap
geneSetSize
oddsRatio
<<<<<<< HEAD
L2
=======
L5
>>>>>>> 689eb11fb5dbc931eb8b6b4a5c5efa65bad315c1
<<<<<<< HEAD
GO:0048584
positive regulation of response to stimulus
=======
GO:0006413
translational initiation
>>>>>>> 689eb11fb5dbc931eb8b6b4a5c5efa65bad315c1
1
<<<<<<< HEAD
-0.195
0.0234
0.995
48
1710
0.723
L3
=======
1.26
0.158
4.36e-43
4.36e-43
95
177
10.7
L6
>>>>>>> 689eb11fb5dbc931eb8b6b4a5c5efa65bad315c1
<<<<<<< HEAD
GO:0006810
transport
0.97
0.322
0.0192
9.31e-13
=======
GO:0070585
protein localization to mitochondrion
1
1.3
0.19
2.14e-08
2.14e-08
>>>>>>> 689eb11fb5dbc931eb8b6b4a5c5efa65bad315c1
218
<<<<<<< HEAD
3830
2.12
L5
=======
117
3.9
SNMF_Topic9
Past versions of positive.snmf.results-8.png
Version
Author
Date
a102c2d
karltayeb
2022-04-13
gobp_nr
geneSet
description
alpha
beta
beta.se
pHypergeometric
pFishersExact
overlap
geneSetSize
oddsRatio
L1
GO:0006302
double-strand break repair
0.996
0.821
0.153
2.03e-07
2.68e-07
64
173
2.96
L2
GO:0006520
cellular amino acid metabolic process
0.994
0.697
0.128
1.89e-07
3.02e-07
86
254
2.59
SNMF_Topic10
Past versions of positive.snmf.results-9.png
Version
Author
Date
a102c2d
karltayeb
2022-04-13
gobp_nr
geneSet
description
alpha
beta
beta.se
pHypergeometric
pFishersExact
overlap
geneSetSize
oddsRatio
L1
GO:0007015
actin filament organization
1
0.78
0.115
3.54e-13
4.8e-13
102
329
3.05
L2
GO:0022613
ribonucleoprotein complex biogenesis
1
-1.31
0.132
1
3.1e-12
17
391
0.288
L3
GO:0048013
ephrin receptor signaling pathway
0.999
1.28
0.231
1.34e-10
1.34e-10
35
75
5.79
SNMF_Topic11
Past versions of positive.snmf.results-10.png
Version
Author
Date
a102c2d
karltayeb
2022-04-13
SNMF_Topic12
Past versions of positive.snmf.results-11.png
Version
Author
Date
a102c2d
karltayeb
2022-04-13
SNMF_Topic13
Past versions of positive.snmf.results-12.png
Version
Author
Date
a102c2d
karltayeb
2022-04-13
SNMF_Topic14
Past versions of positive.snmf.results-13.png
Version
Author
Date
a102c2d
karltayeb
2022-04-13
SNMF_Topic15
Past versions of positive.snmf.results-14.png
Version
Author
Date
a102c2d
karltayeb
2022-04-13
SNMF_Topic16
Past versions of positive.snmf.results-15.png
Version
Author
Date
a102c2d
karltayeb
2022-04-13
SNMF_Topic17
Past versions of positive.snmf.results-16.png
Version
Author
Date
a102c2d
karltayeb
2022-04-13
SNMF_Topic18
Past versions of positive.snmf.results-17.png
Version
Author
Date
a102c2d
karltayeb
2022-04-13
SNMF_Topic19
Past versions of positive.snmf.results-18.png
Version
Author
Date
a102c2d
karltayeb
2022-04-13
SNMF_Topic20
Past versions of positive.snmf.results-19.png
Version
Author
Date
a102c2d
karltayeb
2022-04-13
SNMF - Negative loadings
res <- negative.fits %>%
  filter(str_detect(experiment, '^SNMF*')) %>%
  get_plot_tbl(., negative.ora)

html_tables <- negative.fits %>%
  filter(str_detect(experiment, '^SNMF*')) %>%
  get_table_tbl(., negative.ora)

experiments <- unique(res$experiment)
for (i in 1:length(experiments)){
  this_experiment <- experiments[i]
  cat("\n")
  cat("###", this_experiment, "\n") # Create second level headings with the names.

  # print volcano plot
  p <- do.volcano(res %>% filter(experiment == this_experiment)) +
    labs(title=this_experiment)
  print(p)

  cat("\n\n")

  # print table
  for(db in names(html_tables[[this_experiment]])){
    cat("####", db, "\n") # Create second level headings with the names.
    to_print <- html_tables[[this_experiment]][[db]] %>% distinct()
    to_print %>% report_susie_credible_sets() %>% htmltools::HTML() %>% print()
    cat("\n")
  }}
SNMF_Topic2
Past versions of negative.snmf.results-1.png
Version
Author
Date
a102c2d
karltayeb
2022-04-13
gobp_nr
geneSet
description
alpha
beta
beta.se
pHypergeometric
pFishersExact
overlap
geneSetSize
oddsRatio
L1
GO:0006413
translational initiation
1
1.62
0.163
1.49e-58
1.49e-58
110
177
15.3
L10
GO:0006520
cellular amino acid metabolic process
1
0.979
0.136
8.19e-06
1.09e-05
54
254
2.36
L2
GO:0022613
ribonucleoprotein complex biogenesis
1
1.61
0.108
1.24e-53
1.24e-53
163
391
6.86
L3
GO:0006414
translational elongation
1
2.25
0.185
9.03e-27
9.03e-27
62
121
9.38
L4
GO:0010257
NADH dehydrogenase complex assembly
0.912
2.17
0.301
1.3e-17
1.3e-17
30
46
16.4
GO:0033108
mitochondrial respiratory chain complex assembly
0.0881
1.81
0.262
7.73e-17
7.73e-17
35
64
10.6
L5
GO:0070972
protein localization to endoplasmic reticulum
1
1.96
0.19
2.36e-52
2.36e-52
89
131
19.4
L6
GO:0009123
nucleoside monophosphate metabolic process
1
1.11
0.133
1.45e-18
1.45e-18
82
255
4.26
L7
GO:0036230
granulocyte activation
0.528
0.955
0.112
2.86e-09
3.56e-09
85
384
2.53
GO:0002446
neutrophil mediated immunity
0.472
0.952
0.111
3.72e-09
6.04e-09
85
386
2.51
L8
GO:0070585
protein localization to mitochondrion
0.991
1.32
0.193
2.58e-08
2.58e-08
36
117
3.87
L9
GO:0070646
protein modification by small protein removal
1
0.973
0.137
6.59e-08
7.53e-08
59
249
2.73
SNMF_Topic3
Past versions of negative.snmf.results-2.png
Version
Author
Date
a102c2d
karltayeb
2022-04-13
gobp_nr
geneSet
description
alpha
beta
beta.se
pHypergeometric
pFishersExact
overlap
geneSetSize
oddsRatio
L1
GO:0051321
meiotic cell cycle
0.998
0.935
0.153
5.46e-08
6.52e-08
46
190
3.09
SNMF_Topic4
Past versions of negative.snmf.results-3.png
Version
Author
Date
a102c2d
karltayeb
2022-04-13
gobp_nr
geneSet
description
alpha
beta
beta.se
pHypergeometric
pFishersExact
overlap
geneSetSize
oddsRatio
L1
GO:0072350
tricarboxylic acid metabolic process
1
2.35
0.338
7.25e-09
7.25e-09
13
36
11.7
SNMF_Topic5
Past versions of negative.snmf.results-4.png
Version
Author
Date
a102c2d
karltayeb
2022-04-13
gobp_nr
geneSet
description
alpha
beta
beta.se
pHypergeometric
pFishersExact
overlap
geneSetSize
oddsRatio
L1
GO:0006414
translational elongation
1
1.38
0.193
1.93e-08
1.93e-08
27
121
4.43
SNMF_Topic6
Past versions of negative.snmf.results-5.png
Version
Author
Date
a102c2d
karltayeb
2022-04-13
SNMF_Topic7
Past versions of negative.snmf.results-6.png
Version
Author
Date
a102c2d
karltayeb
2022-04-13
gobp_nr
geneSet
description
alpha
beta
beta.se
pHypergeometric
pFishersExact
overlap
geneSetSize
oddsRatio
L1
GO:0022613
ribonucleoprotein complex biogenesis
1
1.58
0.106
2.03e-80
2.03e-80
232
391
9.4
L10
>>>>>>> 689eb11fb5dbc931eb8b6b4a5c5efa65bad315c1
<<<<<<< HEAD
GO:0034976
response to endoplasmic reticulum stress
1
0.205
0.0206
3.13e-11
34
239
4.6
gomf
geneSet
description
alpha
beta
beta.se
pValueHypergeometric
overlap
geneSetSize
oddsRatio
=======
GO:0006403
RNA localization
0.999
0.926
0.143
3.68e-28
3.68e-28
106
211
6.07
>>>>>>> 689eb11fb5dbc931eb8b6b4a5c5efa65bad315c1
L2
<<<<<<< HEAD
GO:0004888
transmembrane signaling receptor activity
=======
GO:0006397
mRNA processing
>>>>>>> 689eb11fb5dbc931eb8b6b4a5c5efa65bad315c1
1
<<<<<<< HEAD
-0.228
0.0268
=======
1.09
0.102
>>>>>>> 689eb11fb5dbc931eb8b6b4a5c5efa65bad315c1
9.02e-48
<<<<<<< HEAD
6
527
0.297
=======
9.02e-48
201
425
5.64
>>>>>>> 689eb11fb5dbc931eb8b6b4a5c5efa65bad315c1
L3
<<<<<<< HEAD
GO:0004579
dolichyl-diphosphooligosaccharide-protein glycotransferase activity
0.744
0.106
0.0188
2.06e-07
6
9
54
=======
GO:0006413
translational initiation
1
1.63
0.157
6.03e-39
6.03e-39
108
177
9.45
L4
>>>>>>> 689eb11fb5dbc931eb8b6b4a5c5efa65bad315c1
<<<<<<< HEAD
GO:0004576
oligosaccharyl transferase activity
0.255
0.104
0.0191
4.99e-07
6
10
40.5
L4
=======
GO:0071824
protein-DNA complex subunit organization
1
1.07
0.153
1.09e-15
1.82e-15
77
180
4.42
L5
>>>>>>> 689eb11fb5dbc931eb8b6b4a5c5efa65bad315c1
<<<<<<< HEAD
GO:0003756
protein disulfide isomerase activity
=======
GO:0007059
chromosome segregation
>>>>>>> 689eb11fb5dbc931eb8b6b4a5c5efa65bad315c1
0.482
<<<<<<< HEAD
0.0985
0.0186
6.27e-06
6
14
20.2
=======
0.965
0.13
1.02e-12
1.14e-12
91
254
3.31
L6
>>>>>>> 689eb11fb5dbc931eb8b6b4a5c5efa65bad315c1
<<<<<<< HEAD
GO:0016864
intramolecular oxidoreductase activity, transposing S-S bonds
0.482
0.0985
0.0186
6.27e-06
6
14
20.2
kegg
geneSet
description
alpha
beta
beta.se
pValueHypergeometric
overlap
geneSetSize
oddsRatio
L2
=======
GO:0070646
protein modification by small protein removal
1
1.07
0.131
2.71e-13
3.07e-13
91
249
3.42
L7
>>>>>>> 689eb11fb5dbc931eb8b6b4a5c5efa65bad315c1
<<<<<<< HEAD
hsa04141
Protein processing in endoplasmic reticulum
1
0.353
0.0286
3.33e-20
40
149
8.85
L3
hsa04912
GnRH signaling pathway
=======
GO:0010257
NADH dehydrogenase complex assembly
>>>>>>> 689eb11fb5dbc931eb8b6b4a5c5efa65bad315c1
0.927
<<<<<<< HEAD
-0.463
0.0489
=======
1.96
0.293
>>>>>>> 689eb11fb5dbc931eb8b6b4a5c5efa65bad315c1
8.37e-08
<<<<<<< HEAD
0
83
0
L4
=======
8.37e-08
24
46
6.32
>>>>>>> 689eb11fb5dbc931eb8b6b4a5c5efa65bad315c1
<<<<<<< HEAD
hsa04142
Lysosome
=======
GO:0033108
mitochondrial respiratory chain complex assembly
>>>>>>> 689eb11fb5dbc931eb8b6b4a5c5efa65bad315c1
0.0723
<<<<<<< HEAD
0.306
0.0286
2.83e-12
27
116
6.93
L5
=======
1.62
0.257
8.19e-07
8.19e-07
28
64
4.51
L8
>>>>>>> 689eb11fb5dbc931eb8b6b4a5c5efa65bad315c1
<<<<<<< HEAD
hsa05010
Alzheimer disease
1
0.237
0.0311
1.19e-05
20
142
3.61
L6
=======
GO:0098781
ncRNA transcription
0.996
1.46
0.219
5e-16
5e-16
49
88
7.36
L9
>>>>>>> 689eb11fb5dbc931eb8b6b4a5c5efa65bad315c1
<<<<<<< HEAD
hsa03060
Protein export
=======
GO:0061919
process utilizing autophagic mechanism
>>>>>>> 689eb11fb5dbc931eb8b6b4a5c5efa65bad315c1
1
<<<<<<< HEAD
0.153
0.0282
1.23e-08
10
21
19.6
=======
0.689
0.106
6.65e-07
9.1e-07
109
403
2.19
SNMF_Topic8
Past versions of negative.snmf.results-7.png
Version
Author
Date
a102c2d
karltayeb
2022-04-13
SNMF_Topic9
Past versions of negative.snmf.results-8.png
Version
Author
Date
a102c2d
karltayeb
2022-04-13
>>>>>>> 689eb11fb5dbc931eb8b6b4a5c5efa65bad315c1
<<<<<<< HEAD
topic_13
gobp
=======
gobp_nr
>>>>>>> 689eb11fb5dbc931eb8b6b4a5c5efa65bad315c1
geneSet
description
alpha
beta
beta.se
pHypergeometric
pFishersExact
overlap
geneSetSize
oddsRatio
<<<<<<< HEAD
L2
=======
L1
>>>>>>> 689eb11fb5dbc931eb8b6b4a5c5efa65bad315c1
GO:0006413
translational initiation
<<<<<<< HEAD
0.991
0.459
0.0186
1.64e-62
39
92
186
gomf
geneSet
description
alpha
beta
beta.se
pValueHypergeometric
overlap
geneSetSize
oddsRatio
L1
GO:0003735
structural constituent of ribosome
1
0.506
0.0192
3.94e-55
41
152
88.7
=======
1
1.73
0.163
1.36e-14
1.36e-14
36
177
6.03
>>>>>>> 689eb11fb5dbc931eb8b6b4a5c5efa65bad315c1
<<<<<<< HEAD
kegg
geneSet
description
alpha
beta
beta.se
pValueHypergeometric
overlap
geneSetSize
oddsRatio
L1
=======
SNMF_Topic10
Past versions of negative.snmf.results-9.png
Version
Author
Date
>>>>>>> 689eb11fb5dbc931eb8b6b4a5c5efa65bad315c1
<<<<<<< HEAD
hsa03010
Ribosome
1
0.666
0.0277
6.07e-50
41
129
79
=======
a102c2d
karltayeb
2022-04-13
>>>>>>> 689eb11fb5dbc931eb8b6b4a5c5efa65bad315c1
<<<<<<< HEAD
topic_20
gobp
[1] “nothing to report…”
gomf
=======
gobp_nr
>>>>>>> 689eb11fb5dbc931eb8b6b4a5c5efa65bad315c1
geneSet
description
alpha
beta
beta.se
<<<<<<< HEAD
pValueHypergeometric
=======
pHypergeometric
pFishersExact
>>>>>>> 689eb11fb5dbc931eb8b6b4a5c5efa65bad315c1
overlap
geneSetSize
oddsRatio
<<<<<<< HEAD
=======
>>>>>>> 689eb11fb5dbc931eb8b6b4a5c5efa65bad315c1
L1
<<<<<<< HEAD
GO:0022857
transmembrane transporter activity
=======
GO:0070972
protein localization to endoplasmic reticulum
>>>>>>> 689eb11fb5dbc931eb8b6b4a5c5efa65bad315c1
1
<<<<<<< HEAD
-0.419
0.0315
1
1
779
0.117
=======
1.78
0.183
8.46e-37
8.46e-37
48
131
18.8
>>>>>>> 689eb11fb5dbc931eb8b6b4a5c5efa65bad315c1
kegg
[1] “nothing to report…”
topic_11
gobp
[1] “nothing to report…”
gomf
[1] “nothing to report…”
kegg
[1] “nothing to report…”
topic_15
gobp
[1] “nothing to report…”
gomf
[1] “nothing to report…”
kegg
[1] “nothing to report…”
topic_6
gobp
geneSet
description
alpha
beta
beta.se
pValueHypergeometric
overlap
geneSetSize
oddsRatio
<<<<<<< HEAD
L1
=======
L2
>>>>>>> 689eb11fb5dbc931eb8b6b4a5c5efa65bad315c1
<<<<<<< HEAD
GO:0002376
immune system process
=======
GO:1990823
response to leukemia inhibitory factor
>>>>>>> 689eb11fb5dbc931eb8b6b4a5c5efa65bad315c1
1
<<<<<<< HEAD
0.353
0.02
5.89e-43
198
2020
4.39
=======
2.08
0.229
1.65e-10
1.65e-10
19
89
8.12
>>>>>>> 689eb11fb5dbc931eb8b6b4a5c5efa65bad315c1
L3
<<<<<<< HEAD
GO:0046649
lymphocyte activation
=======
GO:0006413
translational initiation
>>>>>>> 689eb11fb5dbc931eb8b6b4a5c5efa65bad315c1
1
<<<<<<< HEAD
0.172
0.0201
3.99e-28
78
495
5.79
L4
=======
1.71
0.161
1.51e-36
1.51e-36
54
177
14.5
SNMF_Topic11
Past versions of negative.snmf.results-10.png
Version
Author
Date
>>>>>>> 689eb11fb5dbc931eb8b6b4a5c5efa65bad315c1
<<<<<<< HEAD
GO:0006952
defense response
=======
a102c2d
karltayeb
2022-04-13
>>>>>>> 689eb11fb5dbc931eb8b6b4a5c5efa65bad315c1
SNMF_Topic12
Past versions of negative.snmf.results-11.png
Version
Author
Date
a102c2d
<<<<<<< HEAD
0.196
0.0205
1.72e-31
=======
karltayeb
2022-04-13
gobp_nr
geneSet
description
alpha
beta
beta.se
pHypergeometric
pFishersExact
overlap
geneSetSize
oddsRatio
L1
GO:0006414
translational elongation
>>>>>>> 689eb11fb5dbc931eb8b6b4a5c5efa65bad315c1
120
<<<<<<< HEAD
1010
4.5
L5
GO:0033554
cellular response to stress
0.999
-0.134
0.0233
0.826
53
1560
0.919
L6
=======
1.78
0.189
5.07e-15
5.07e-15
36
121
6.7
L2
GO:0022613
ribonucleoprotein complex biogenesis
1
1.1
0.113
2.27e-15
2.27e-15
71
391
3.62
L3
>>>>>>> 689eb11fb5dbc931eb8b6b4a5c5efa65bad315c1
<<<<<<< HEAD
GO:0071840
cellular component organization or biogenesis
0.937
-0.204
0.0192
1
156
5030
0.76
GO:0016043
cellular component organization
0.0631
-0.201
0.0194
0.999
155
4880
0.794
=======
GO:0071824
protein-DNA complex subunit organization
1
1.26
0.162
5.58e-09
5.58e-09
35
180
3.79
SNMF_Topic13
Past versions of negative.snmf.results-12.png
Version
Author
Date
a102c2d
karltayeb
2022-04-13
>>>>>>> 689eb11fb5dbc931eb8b6b4a5c5efa65bad315c1
<<<<<<< HEAD
gomf
=======
gobp_nr
>>>>>>> 689eb11fb5dbc931eb8b6b4a5c5efa65bad315c1
geneSet
description
alpha
beta
beta.se
pHypergeometric
pFishersExact
overlap
geneSetSize
oddsRatio
<<<<<<< HEAD
L3
=======
L1
>>>>>>> 689eb11fb5dbc931eb8b6b4a5c5efa65bad315c1
<<<<<<< HEAD
GO:0038023
signaling receptor activity
=======
GO:0070972
protein localization to endoplasmic reticulum
>>>>>>> 689eb11fb5dbc931eb8b6b4a5c5efa65bad315c1
0.995
<<<<<<< HEAD
0.266
0.021
3.85e-14
70
697
3.3
L4
GO:0050662
coenzyme binding
1
-0.162
0.0273
0.999
2
239
0.218
kegg
geneSet
description
alpha
beta
beta.se
pValueHypergeometric
overlap
geneSetSize
oddsRatio
L2
=======
4.8
0.182
3.21e-58
3.21e-58
40
131
127
SNMF_Topic14
Past versions of negative.snmf.results-13.png
Version
Author
Date
a102c2d
karltayeb
2022-04-13
SNMF_Topic15
Past versions of negative.snmf.results-14.png
Version
Author
Date
>>>>>>> 689eb11fb5dbc931eb8b6b4a5c5efa65bad315c1
<<<<<<< HEAD
hsa01100
Metabolic pathways
1
-0.292
0.0346
1
21
1020
0.432
L3
=======
a102c2d
karltayeb
2022-04-13
>>>>>>> 689eb11fb5dbc931eb8b6b4a5c5efa65bad315c1
SNMF_Topic16
Past versions of negative.snmf.results-15.png
Version
Author
Date
<<<<<<< HEAD
hsa04621
NOD-like receptor signaling pathway
1
0.189
0.0298
5.94e-08
21
125
5.04
L4
=======
a102c2d
karltayeb
2022-04-13
>>>>>>> 689eb11fb5dbc931eb8b6b4a5c5efa65bad315c1
SNMF_Topic17
Past versions of negative.snmf.results-16.png
<<<<<<< HEAD
hsa04062
Chemokine signaling pathway
1
0.198
0.0299
4.12e-08
23
145
4.73
=======
Version
Author
Date
a102c2d
karltayeb
2022-04-13
>>>>>>> 689eb11fb5dbc931eb8b6b4a5c5efa65bad315c1
<<<<<<< HEAD
topic_18
gobp
=======
gobp_nr
>>>>>>> 689eb11fb5dbc931eb8b6b4a5c5efa65bad315c1
geneSet
description
alpha
beta
beta.se
pHypergeometric
pFishersExact
overlap
geneSetSize
oddsRatio
<<<<<<< HEAD
L2
=======
L1
>>>>>>> 689eb11fb5dbc931eb8b6b4a5c5efa65bad315c1
<<<<<<< HEAD
GO:0051174
regulation of phosphorus metabolic process
=======
GO:0034976
response to endoplasmic reticulum stress
>>>>>>> 689eb11fb5dbc931eb8b6b4a5c5efa65bad315c1
0.503
<<<<<<< HEAD
-0.37
0.0308
0.997
2
1360
0.241
GO:0019220
regulation of phosphate metabolic process
0.497
-0.37
0.0308
0.997
2
1360
0.241
=======
1.45
0.147
3.72e-11
3.72e-11
34
239
4.58
>>>>>>> 689eb11fb5dbc931eb8b6b4a5c5efa65bad315c1
<<<<<<< HEAD
gomf
[1] “nothing to report…”
kegg
[1] “nothing to report…”
topic_16
gobp
[1] “nothing to report…”
gomf
[1] “nothing to report…”
kegg
[1] “nothing to report…”
topic_14
gobp
[1] “nothing to report…”
gomf
[1] “nothing to report…”
kegg
[1] “nothing to report…”
topic_19
gobp
[1] “nothing to report…”
gomf
geneSet
description
alpha
beta
beta.se
pValueHypergeometric
overlap
geneSetSize
oddsRatio
L1
=======
SNMF_Topic18
Past versions of negative.snmf.results-17.png
Version
Author
Date
>>>>>>> 689eb11fb5dbc931eb8b6b4a5c5efa65bad315c1
<<<<<<< HEAD
GO:0003824
catalytic activity
1
-0.284
0.0222
1
42
4550
0.545
kegg
geneSet
description
alpha
beta
beta.se
pValueHypergeometric
overlap
geneSetSize
oddsRatio
L2
=======
a102c2d
karltayeb
2022-04-13
SNMF_Topic19
Past versions of negative.snmf.results-18.png
Version
Author
Date
a102c2d
karltayeb
2022-04-13
SNMF_Topic20
Past versions of negative.snmf.results-19.png
Version
Author
Date
>>>>>>> 689eb11fb5dbc931eb8b6b4a5c5efa65bad315c1
<<<<<<< HEAD
hsa01100
Metabolic pathways
1
-0.229
0.0374
0.993
8
1020
0.466
=======
a102c2d
karltayeb
2022-04-13
>>>>>>> 689eb11fb5dbc931eb8b6b4a5c5efa65bad315c1
<<<<<<< HEAD
sessionInfo()R version 4.1.0 (2021-05-18)
Platform: x86_64-pc-linux-gnu (64-bit)
Running under: Scientific Linux 7.4 (Nitrogen)
Matrix products: default
BLAS/LAPACK: /software/openblas-0.3.13-el7-x86_64/lib/libopenblas_haswellp-r0.3.13.so
locale:
[1] LC_CTYPE=en_US.UTF-8 LC_NUMERIC=C
[3] LC_TIME=en_US.UTF-8 LC_COLLATE=en_US.UTF-8
[5] LC_MONETARY=en_US.UTF-8 LC_MESSAGES=en_US.UTF-8
[7] LC_PAPER=en_US.UTF-8 LC_NAME=C
[9] LC_ADDRESS=C LC_TELEPHONE=C
[11] LC_MEASUREMENT=en_US.UTF-8 LC_IDENTIFICATION=C
attached base packages:
[1] stats graphics grDevices datasets utils methods base
other attached packages:
[1] htmltools_0.5.2 Matrix_1.4-0 forcats_0.5.1 stringr_1.4.0
[5] dplyr_1.0.7 purrr_0.3.4 readr_2.1.1 tidyr_1.1.4
[9] tibble_3.1.6 ggplot2_3.3.5 tidyverse_1.3.1 kableExtra_1.3.4
[13] DT_0.18 susieR_0.11.92
loaded via a namespace (and not attached):
[1] colorspace_2.0-2 ellipsis_0.3.2 rprojroot_2.0.2
[4] XVector_0.34.0 fs_1.5.2 rstudioapi_0.13
[7] bit64_4.0.5 AnnotationDbi_1.56.1 fansi_0.5.0
[10] lubridate_1.8.0 xml2_1.3.3 sparseMatrixStats_1.6.0
[13] codetools_0.2-18 doParallel_1.0.16 cachem_1.0.6
[16] knitr_1.37 jsonlite_1.7.2 workflowr_1.7.0
[19] apcluster_1.4.8 WebGestaltR_0.4.4 broom_0.7.11
[22] cluster_2.1.2 dbplyr_2.1.1 png_0.1-7
[25] wordspace_0.2-7 BiocManager_1.30.16 compiler_4.1.0
[28] httr_1.4.2 backports_1.4.1 assertthat_0.2.1
[31] fastmap_1.1.0 cli_3.1.0 later_1.3.0
[34] prettyunits_1.1.1 tools_4.1.0 igraph_1.2.11
[37] GenomeInfoDbData_1.2.7 gtable_0.3.0 glue_1.6.0
[40] doRNG_1.8.2 Rcpp_1.0.7 Biobase_2.54.0
[43] cellranger_1.1.0 jquerylib_0.1.4 vctrs_0.3.8
[46] Biostrings_2.62.0 svglite_2.0.0 iterators_1.0.13
[49] xfun_0.29 rvest_1.0.2 lifecycle_1.0.1
[52] irlba_2.3.5 renv_0.15.0 rngtools_1.5.2
[55] org.Hs.eg.db_3.14.0 MASS_7.3-54 zlibbioc_1.40.0
[58] scales_1.1.1 vroom_1.5.7 MatrixGenerics_1.6.0
[61] hms_1.1.1 promises_1.2.0.1 parallel_4.1.0
[64] yaml_2.2.1 curl_4.3.2 memoise_2.0.1
[67] sass_0.4.0 reshape_0.8.8 stringi_1.7.6
[70] RSQLite_2.2.8 highr_0.9 S4Vectors_0.32.3
[73] foreach_1.5.1 BiocGenerics_0.40.0 GenomeInfoDb_1.30.0
[76] bitops_1.0-7 rlang_0.4.12 pkgconfig_2.0.3
[79] systemfonts_1.0.2 matrixStats_0.61.0 evaluate_0.14
[82] lattice_0.20-45 htmlwidgets_1.5.3 bit_4.0.4
[85] tidyselect_1.1.1 plyr_1.8.6 magrittr_2.0.1
[88] R6_2.5.1 IRanges_2.28.0 generics_0.1.1
[91] DBI_1.1.2 pillar_1.6.4 haven_2.4.3
[94] whisker_0.4 withr_2.4.3 KEGGREST_1.34.0
[97] RCurl_1.98-1.5 mixsqp_0.3-43 modelr_0.1.8
[100] crayon_1.4.2 utf8_1.2.2 tzdb_0.2.0
[103] rmarkdown_2.11 progress_1.2.2 grid_4.1.0
[106] readxl_1.3.1 blob_1.2.2 git2r_0.29.0
[109] sparsesvd_0.2 reprex_2.0.1 digest_0.6.29
[112] webshot_0.5.2 httpuv_1.6.5 stats4_4.1.0
[115] munsell_0.5.0 viridisLite_0.4.0 bslib_0.2.5.1
[118] iotools_0.3-2
=======
>>>>>>> 689eb11fb5dbc931eb8b6b4a5c5efa65bad315c1
knitr::knit_exit()